Alert Metrics
Helicone supports monitoring multiple metrics to help you track different aspects of your LLM application:Creating Alerts
Navigate to Settings → Alerts in your Helicone dashboard to create new alerts.1
Configure
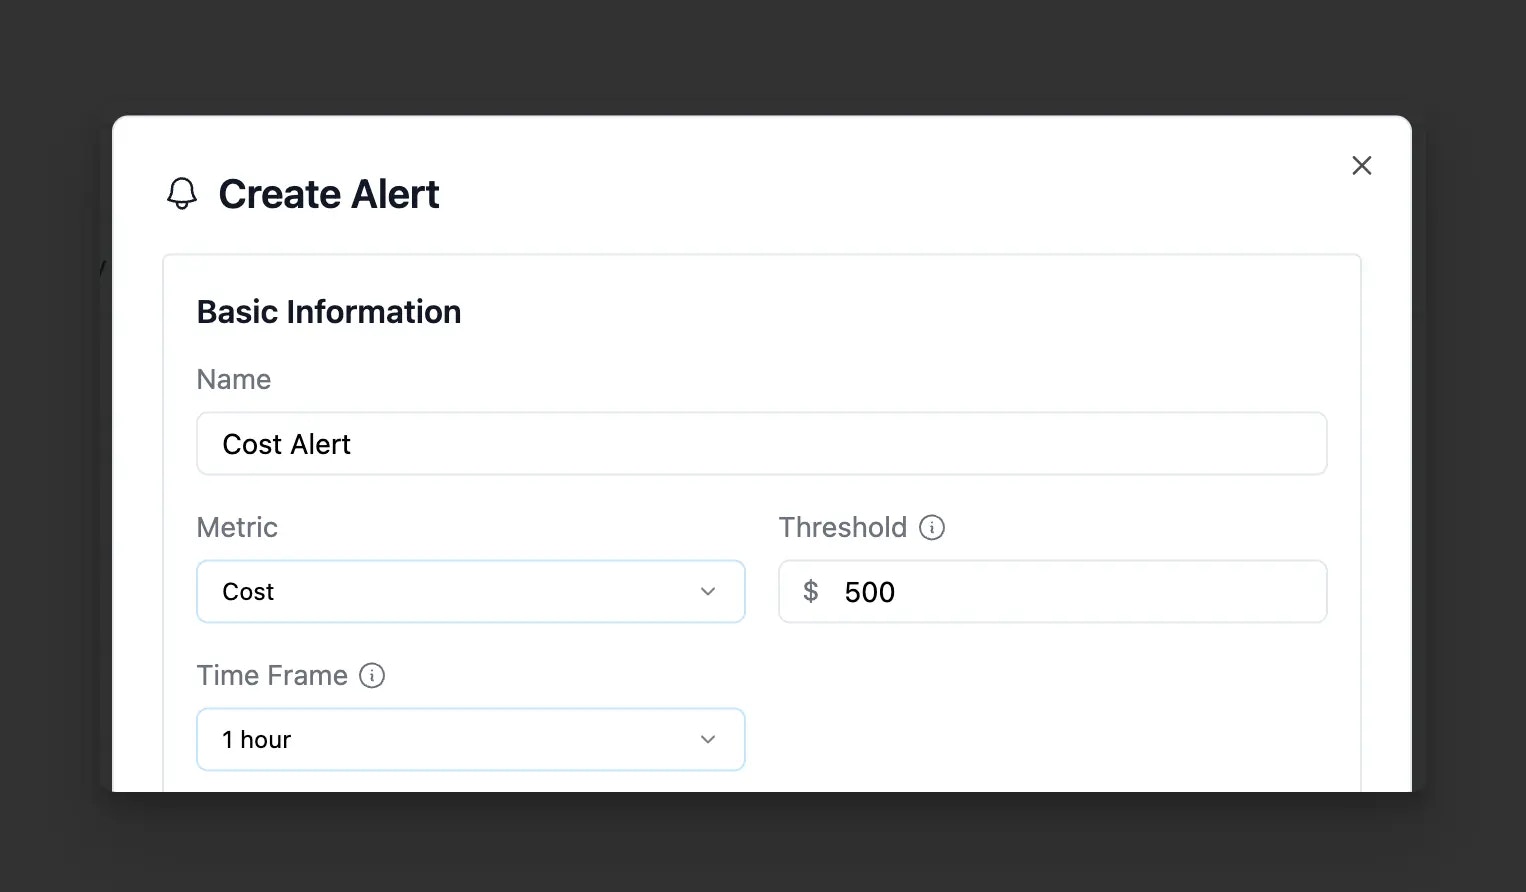
Configuring an alert in Helicone
2
Advanced Configuration (optional)
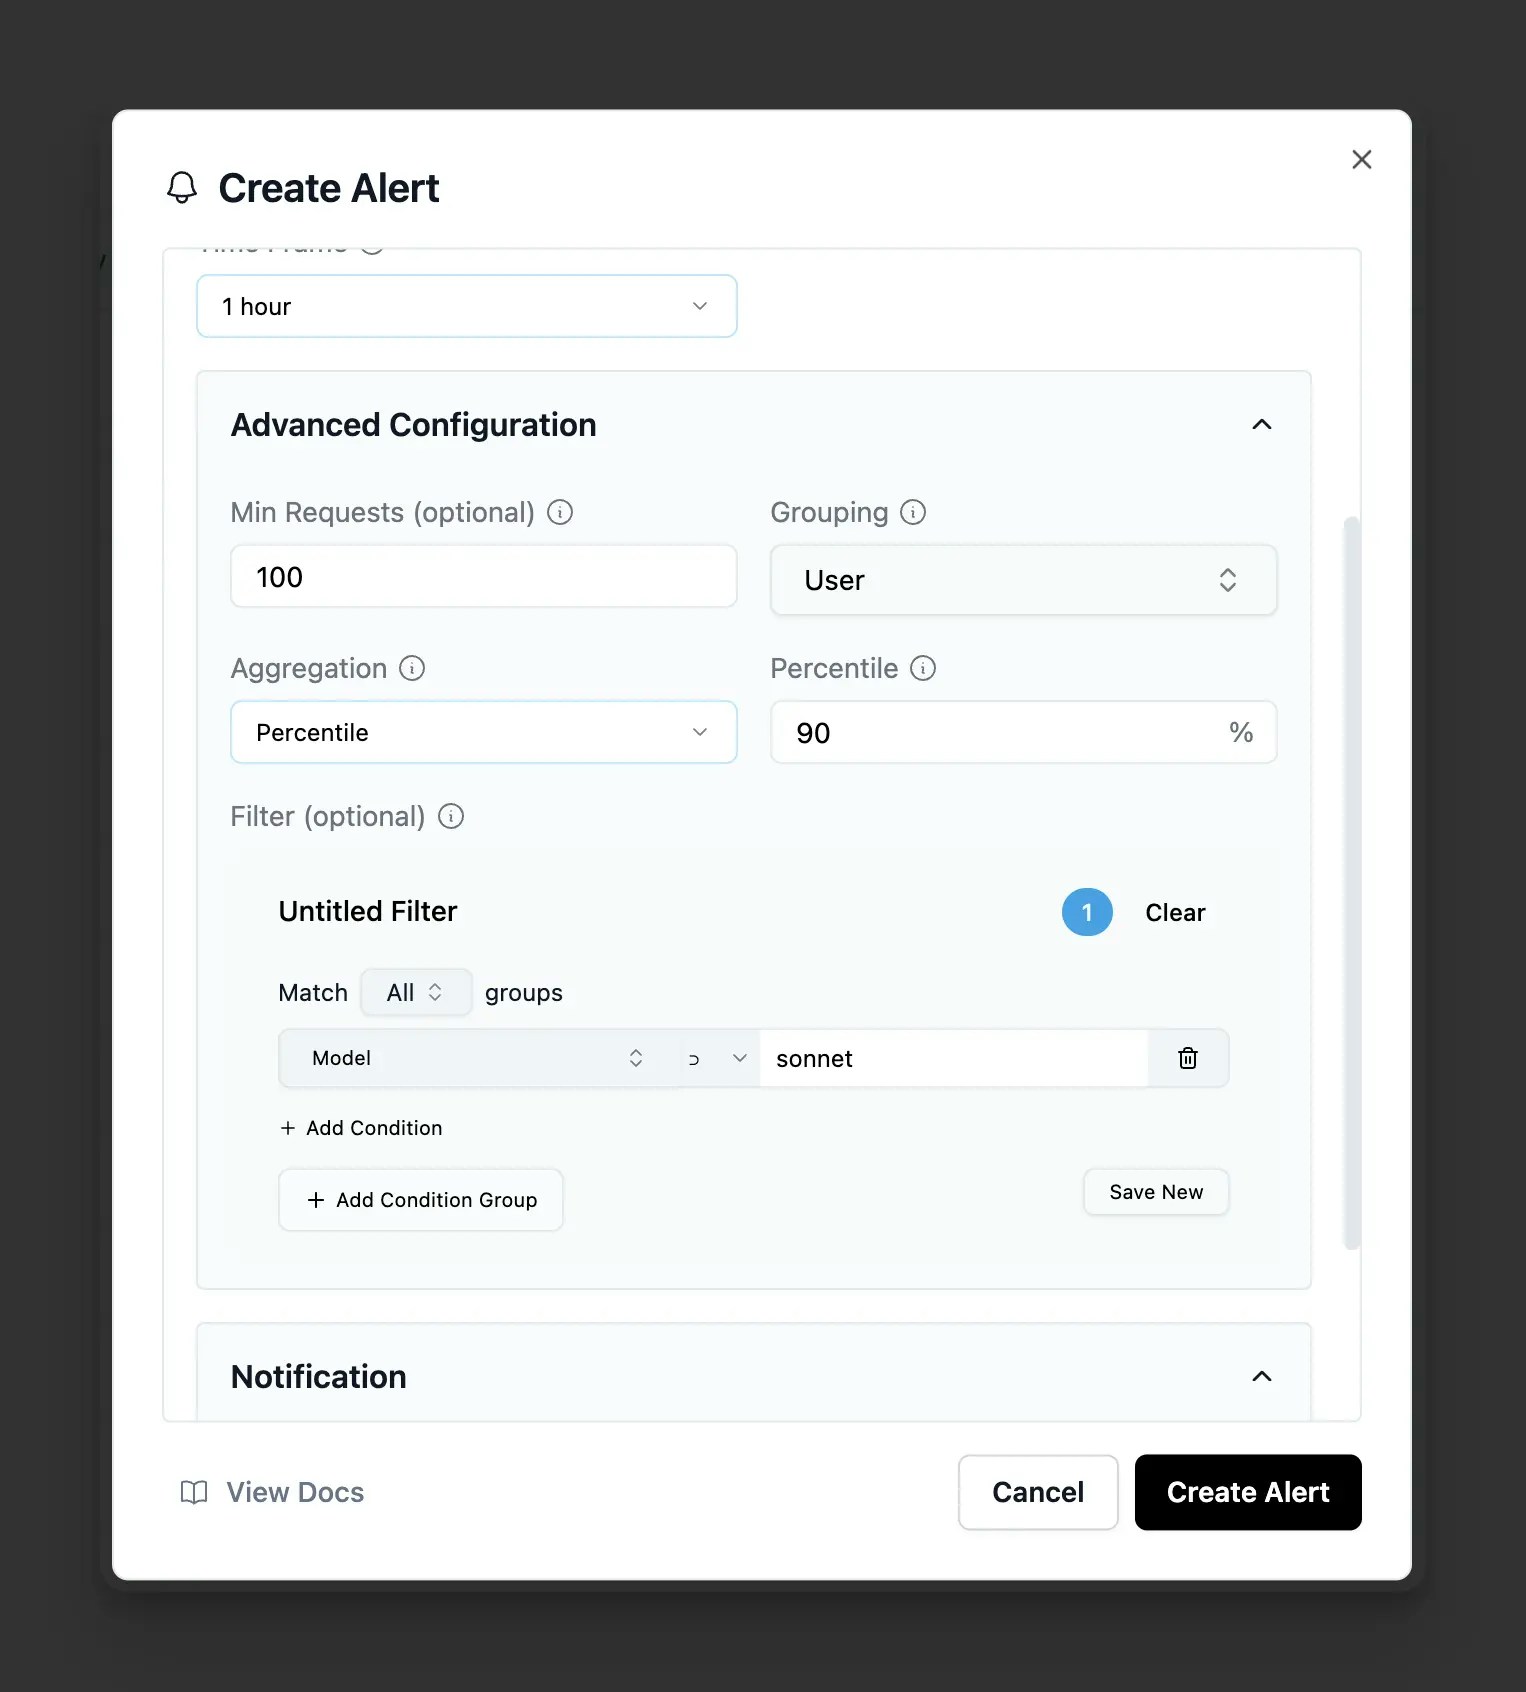
Advanced alert configuration options
3
Configure notifications
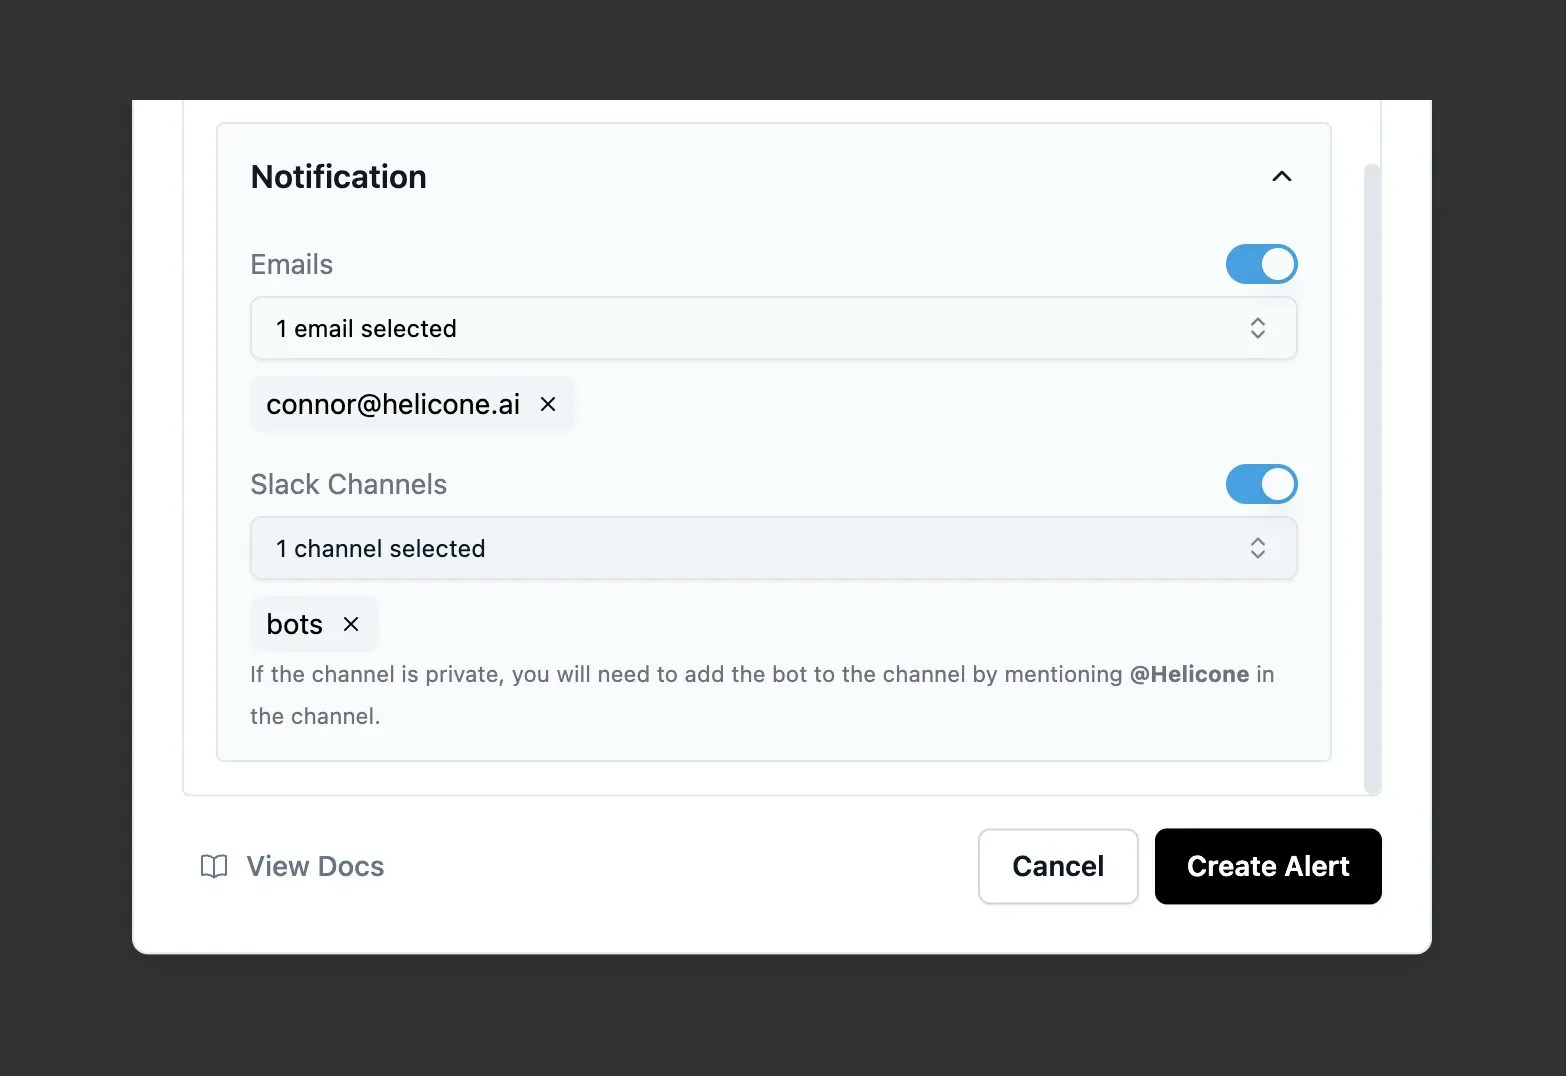
Setting up alert notifications
- Email: Add any email address (immediate delivery)
- Slack: Select connected channels (#alerts, #engineering, etc.)
- Multiple recipients: Add several emails or channels per alert
4
Monitor
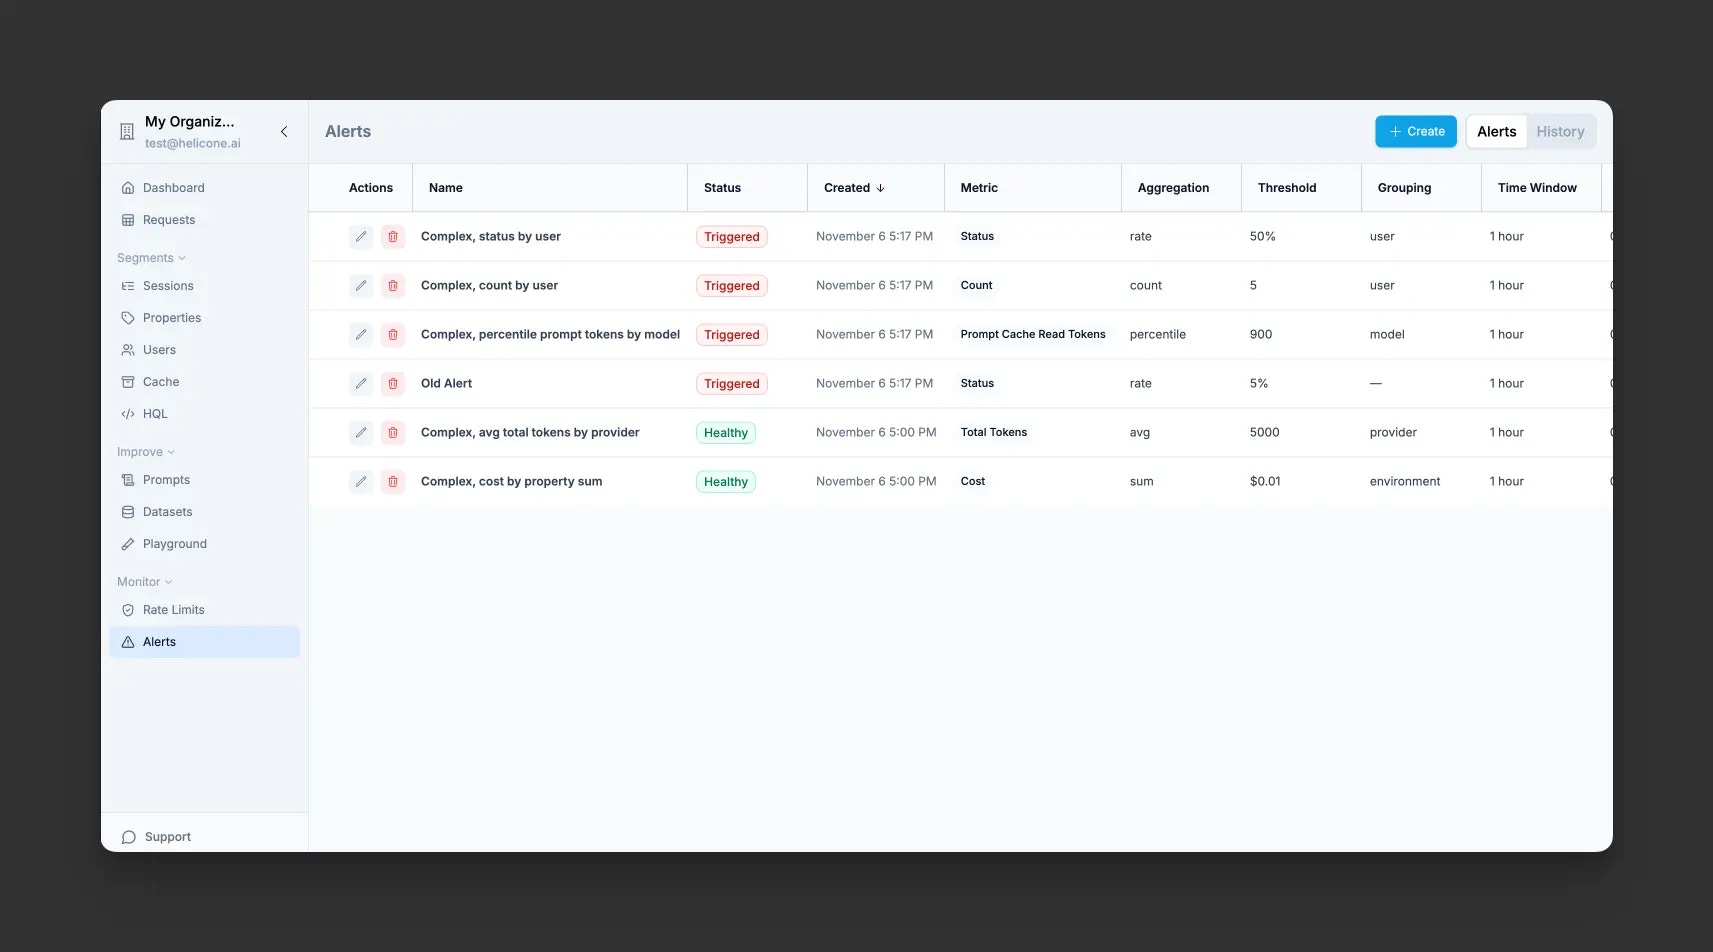
Helicone Alerts Dashboard showing configured alerts and their status
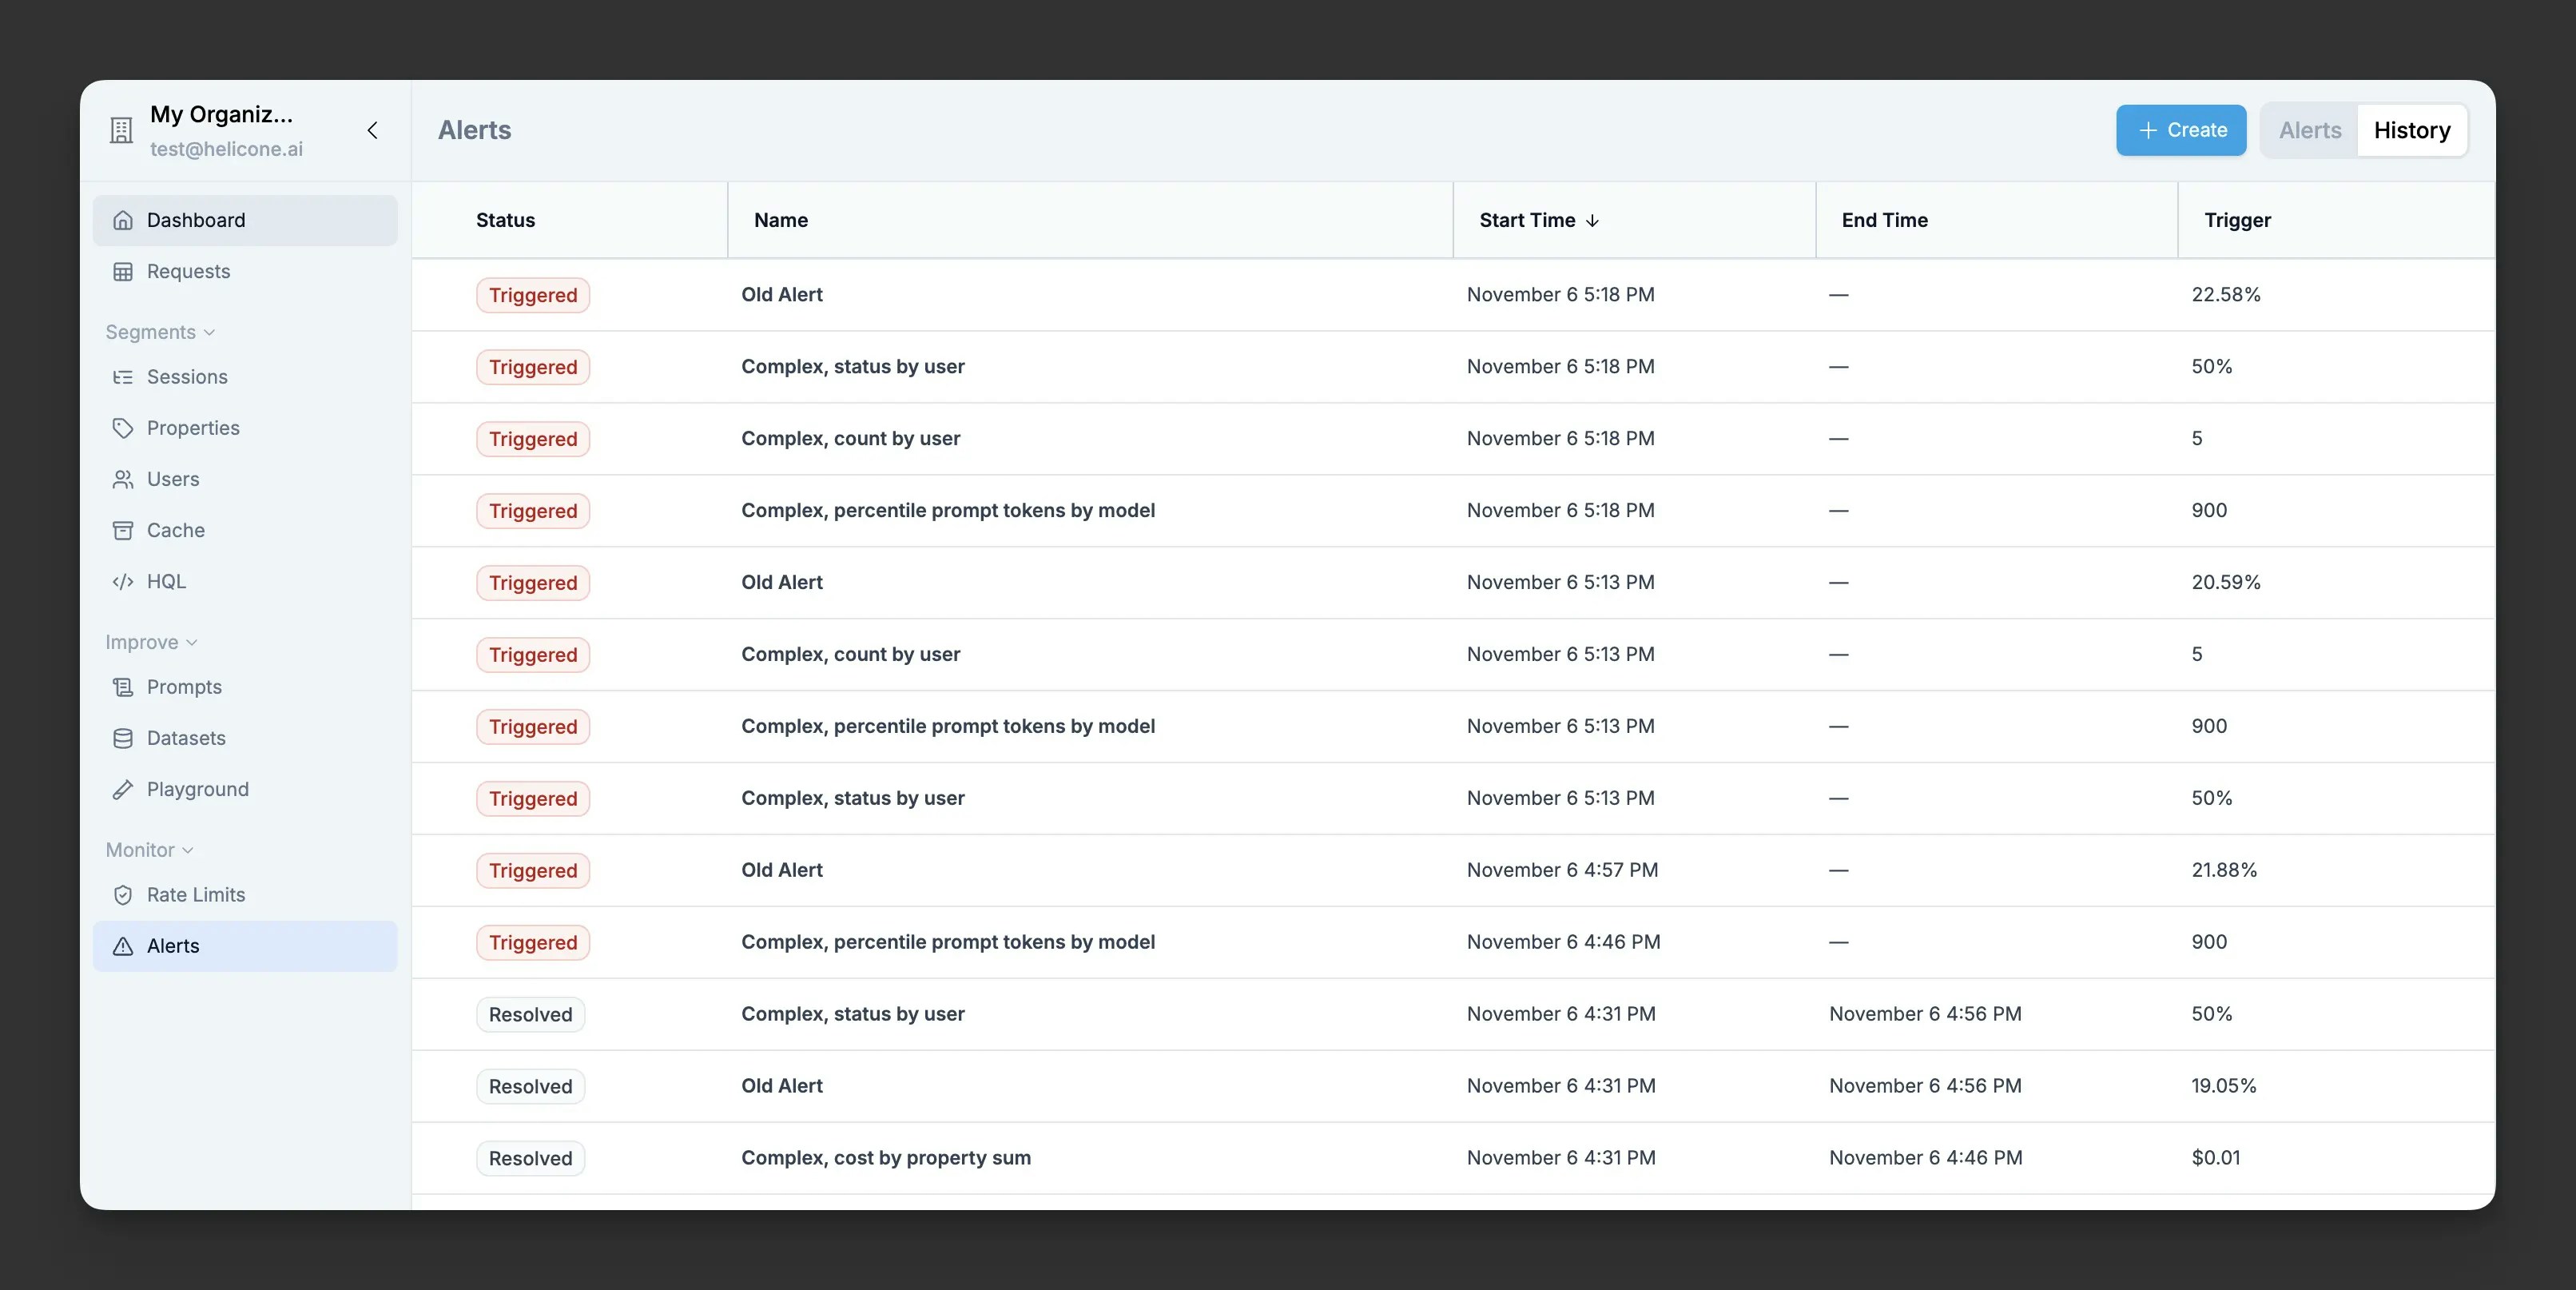
Alert history showing recent triggers
Configuration
Basic Configuration
Every alert requires these fundamental settings:- Metric - Choose from error rate, cost, latency, token metrics (total, prompt, completion, cache read/write), or request count
- Threshold - The value that triggers the alert:
- Error rate: Percentage (e.g., 5-10% for production)
- Cost: Dollar amount (e.g., 1000)
- Latency: Milliseconds (e.g., 1000ms, 5000ms)
- Tokens: Token count (e.g., 100000, 1000000)
- Count: Number of requests (e.g., 1000, 10000)
- Time Frame - Evaluation window for aggregating metrics (e.g., last 30 minutes, last 24 hours, last 30 days)
Advanced Configuration (Optional)
Fine-tune your alerts with these optional settings:- Min Requests - Minimum number of requests required before the alert can trigger. Prevents false positives during low traffic periods (e.g., set to 10 to require at least 10 requests in the time window)
-
Grouping - Break down alerts by specific dimensions to track violations per group:
- Standard groupings: User, Model, Provider
- Custom properties: Any custom property you’ve added to your requests
- When enabled, the alert tracks each group independently and shows which specific groups violated the threshold
-
Aggregation - Choose how to calculate the metric value:
- Sum (default): Total of all values (e.g., total cost, total tokens)
- Average: Mean value across requests (e.g., average latency)
- Min: Minimum value observed
- Max: Maximum value observed
- Percentile: Specify a percentile (e.g., p50, p95, p99 for latency)
- Filter - Target specific subsets of your traffic using the same powerful filter system as the Requests page
Notification Channels
Email Notifications
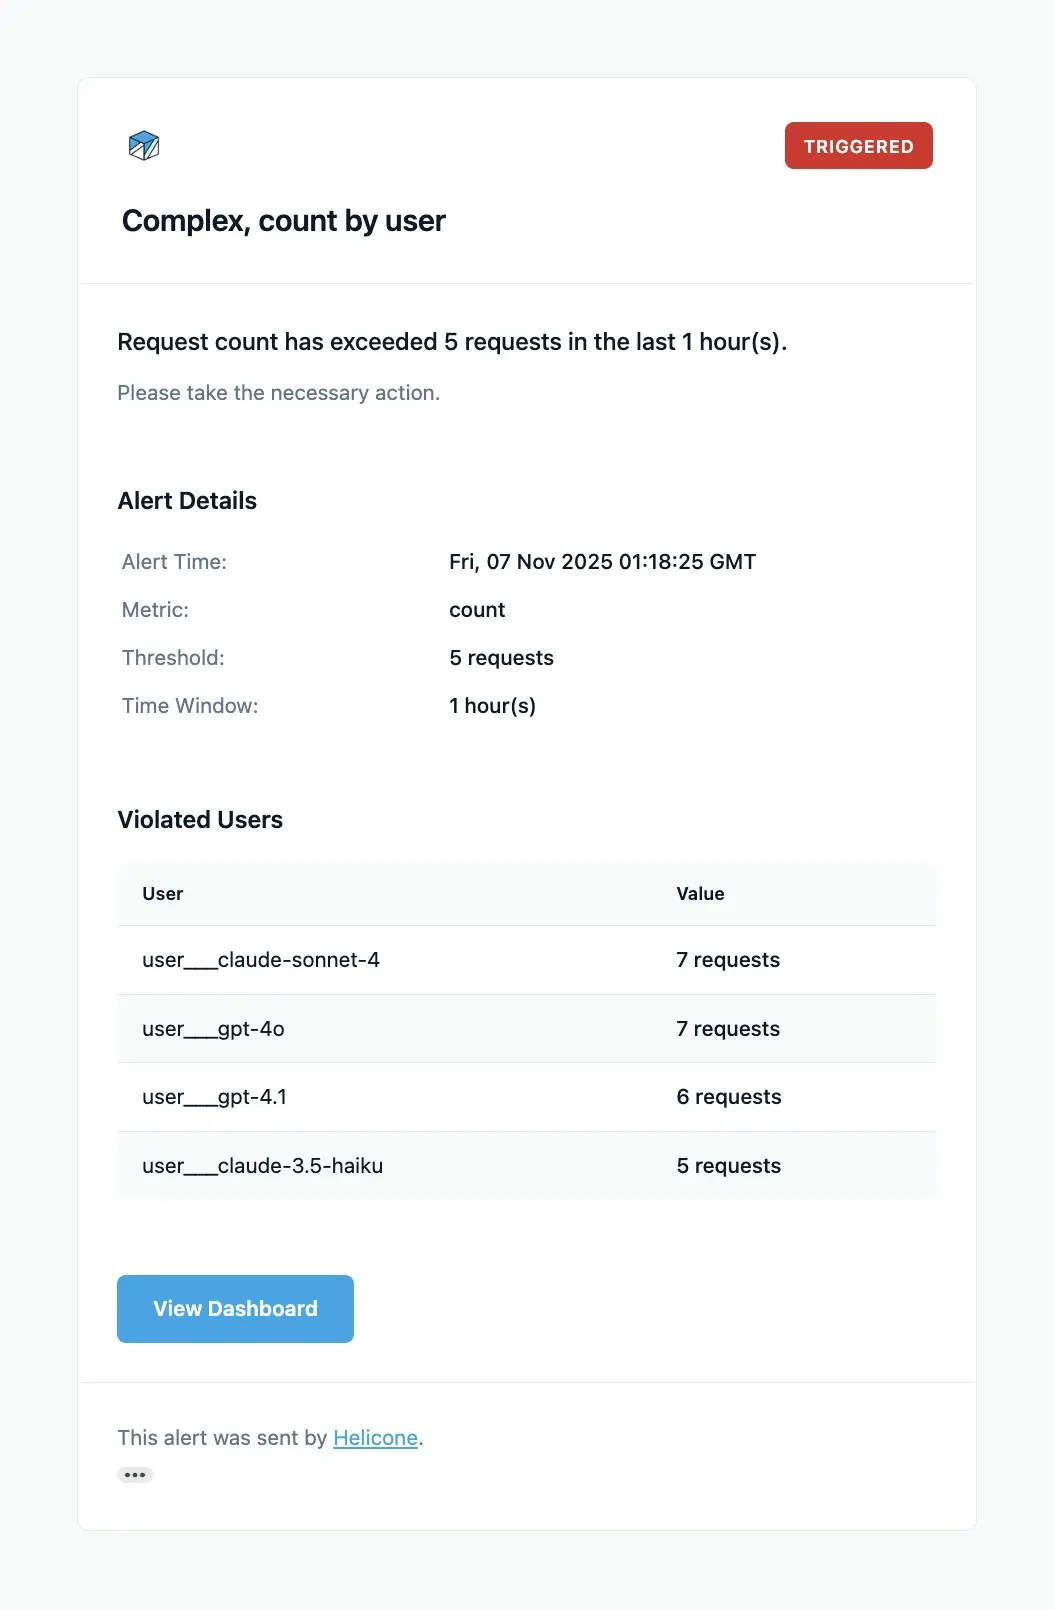
Example alert notification email
Slack Integration
When creating or editing an alert:- Select Slack as the notification method
- Click Connect Slack button that appears
- Authorize Helicone in your Slack workspace
- Select a channel from the dropdown (#alerts, #engineering, etc.)
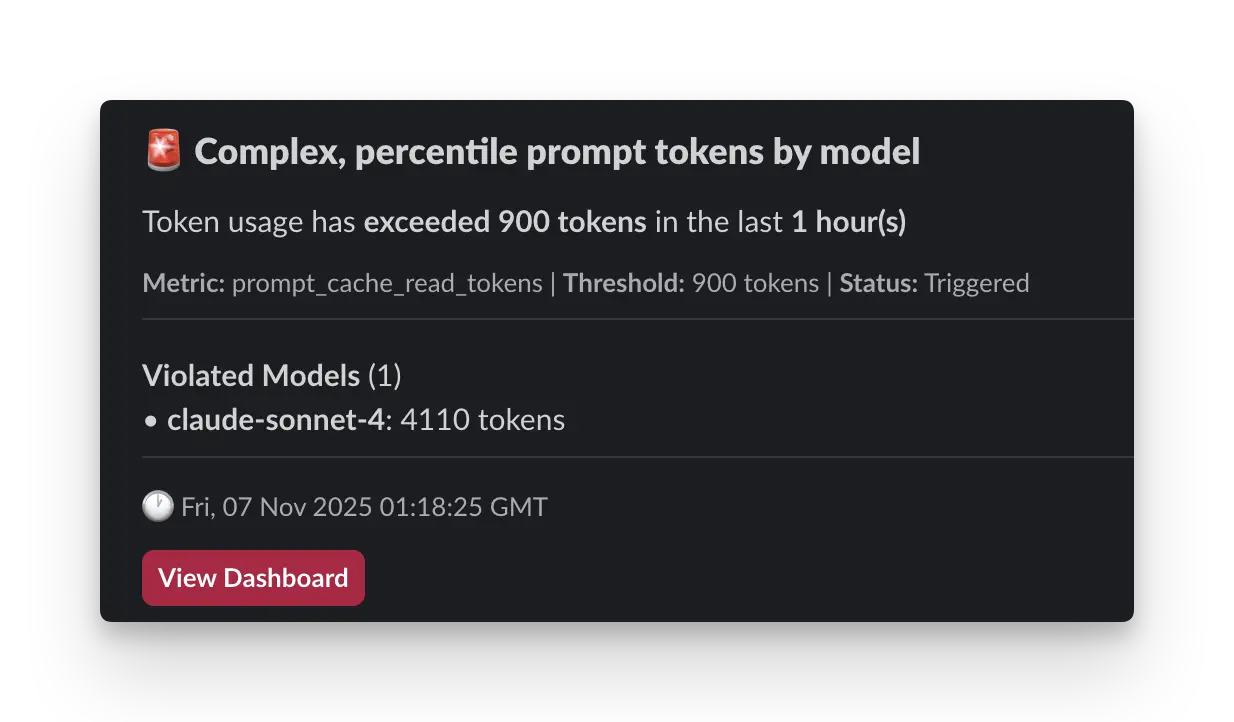
Example alert notification in Slack
Related Features
Custom Properties
Filter alerts by environment, feature, or user segment
User Metrics
Track costs and errors per user to set appropriate thresholds
Sessions
Monitor multi-step workflows that might trigger alerts
Datasets
Collect examples of requests that triggered alerts for analysis