> ## Documentation Index
> Fetch the complete documentation index at: https://docs.helicone.ai/llms.txt
> Use this file to discover all available pages before exploring further.
# Reports
> Get automated weekly summaries of your LLM usage, costs, and performance delivered to email or Slack
Receive comprehensive insights about your LLM application's performance with automated weekly reports. Stay informed about spending trends, usage patterns, and optimization opportunities without logging into the dashboard.
## Why Reports
Weekly summaries delivered directly to your inbox or Slack
Monitor week-over-week changes in usage, costs, and performance
Keep stakeholders updated automatically
## What's Included
Weekly reports provide key metrics from the past 7 days:
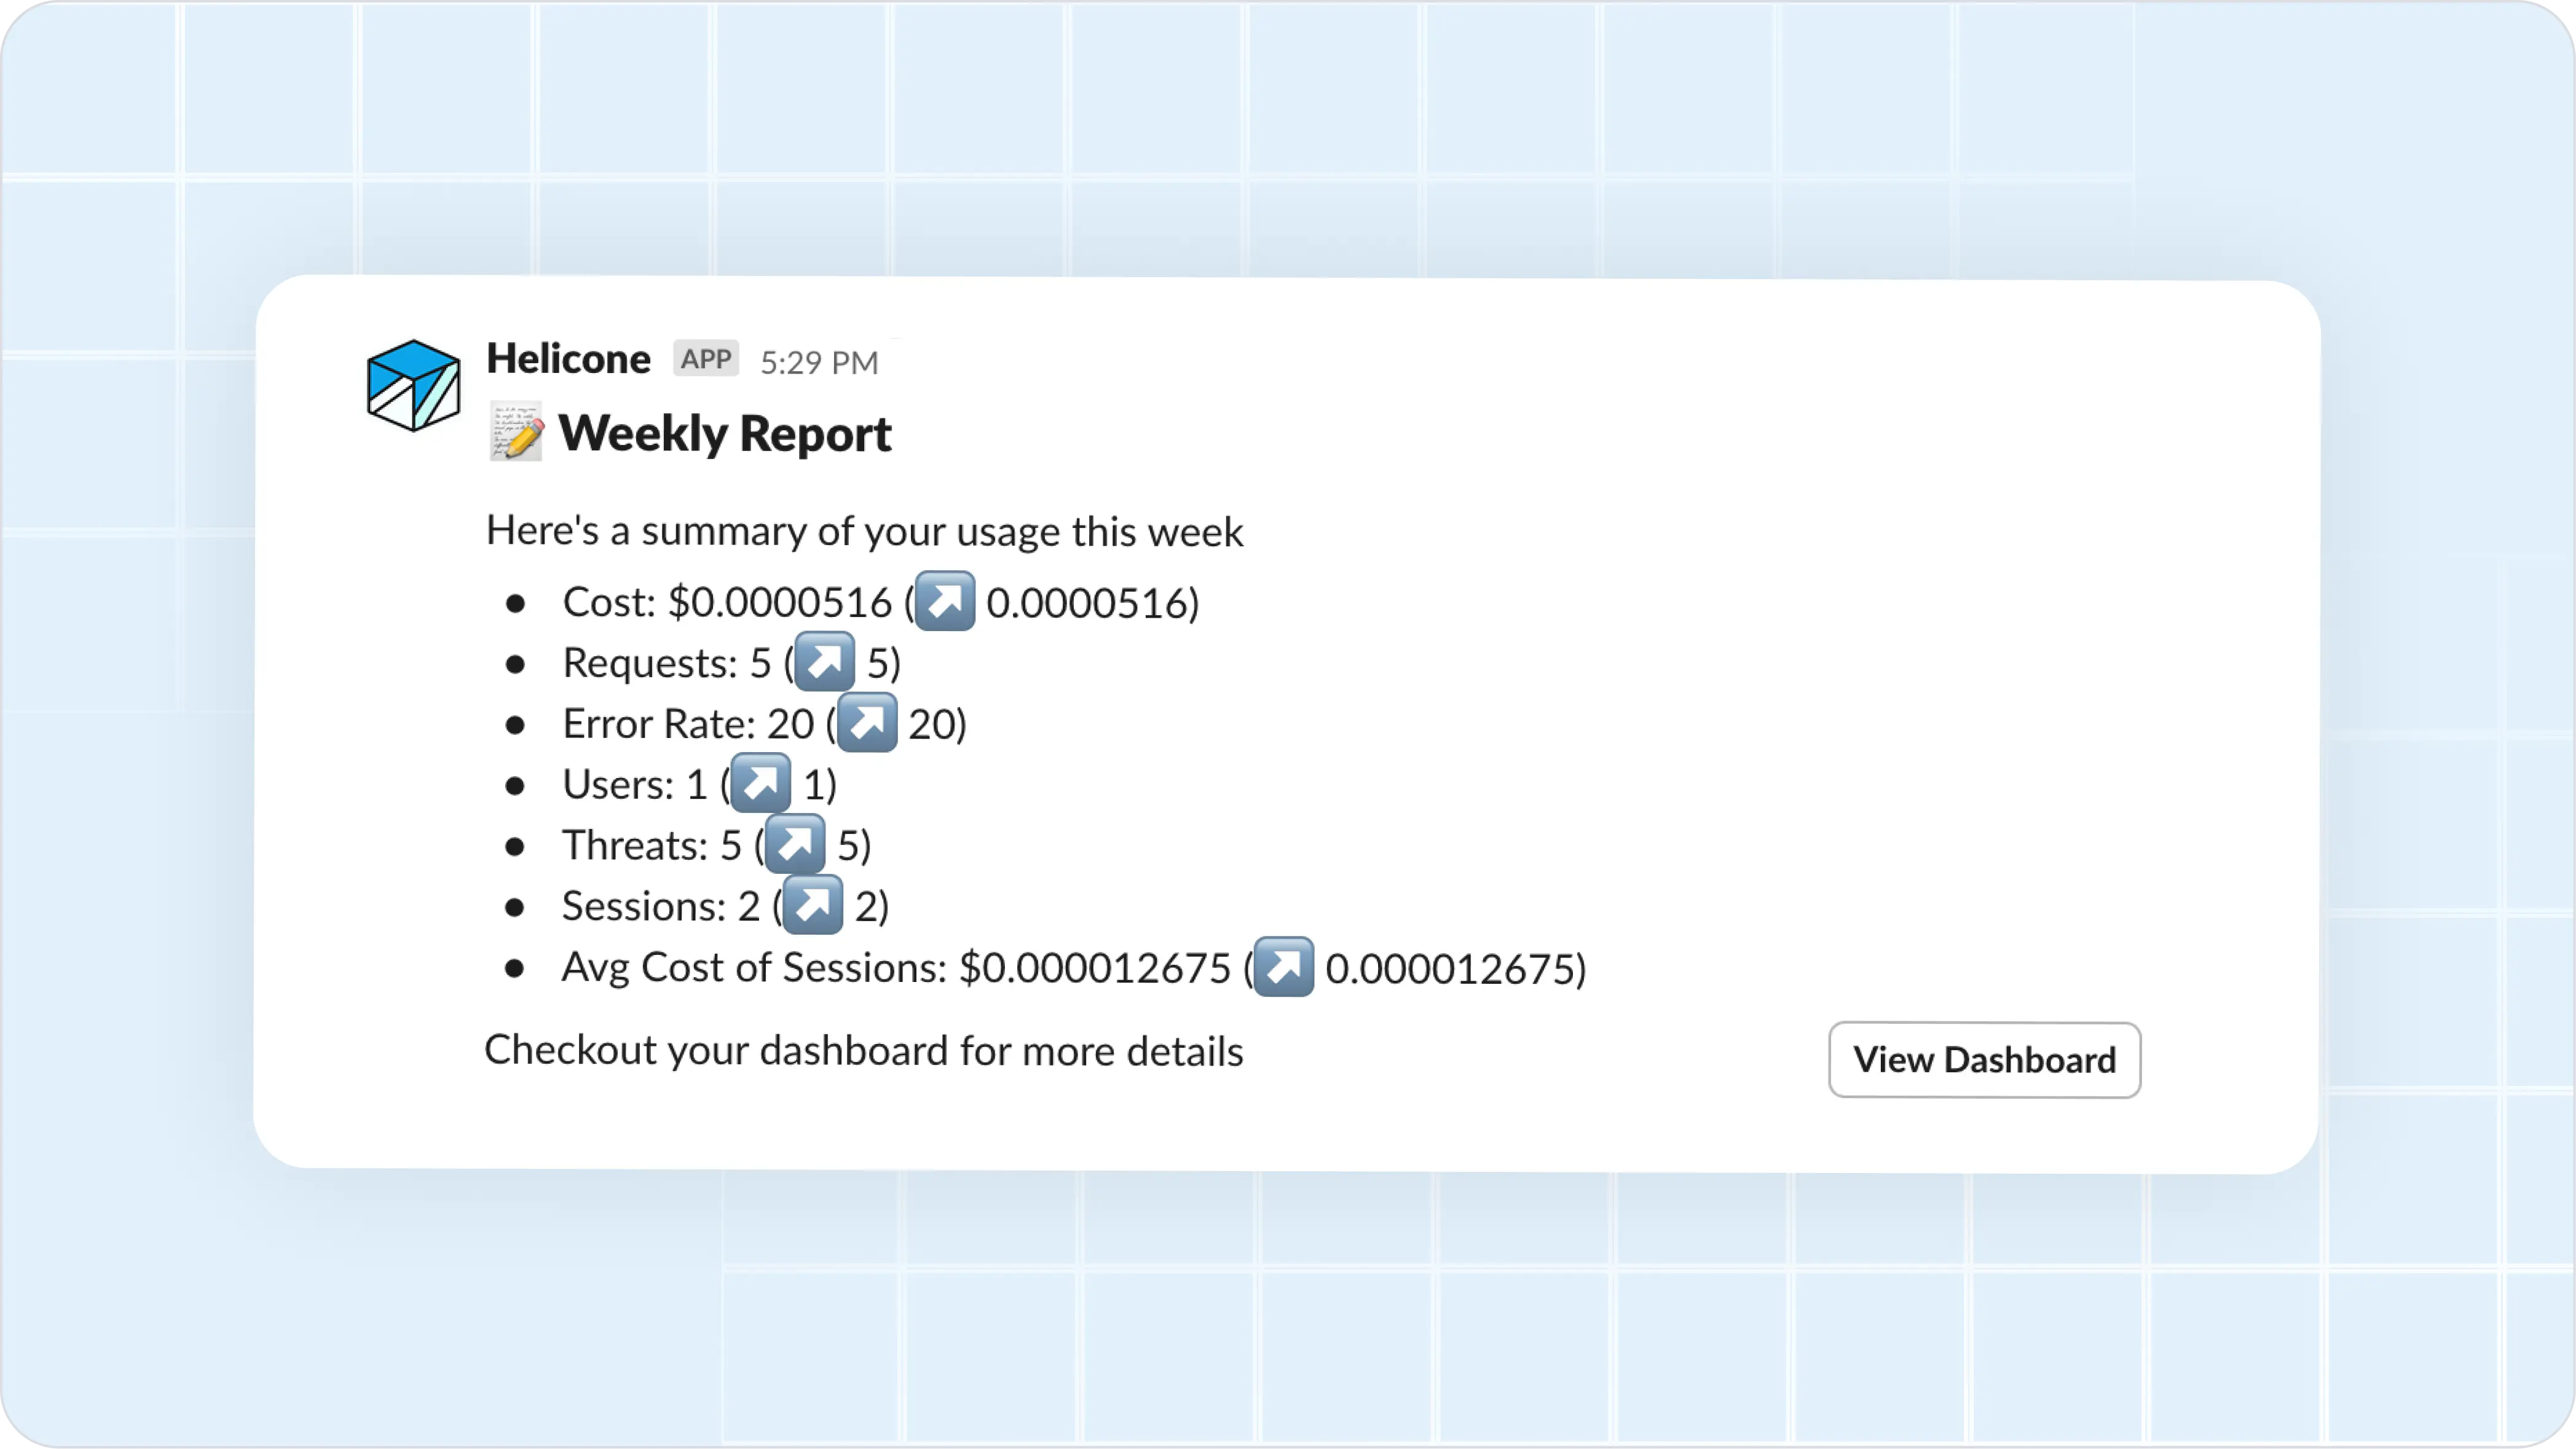
* **Total cost** and spending trends
* **Number of requests** processed
* **Error rate** percentage
* **Active users** count
* **Security threats** detected
* **Sessions** count and average cost per session
## Setting Up Reports
Navigate to **Settings → Reports** in your Helicone dashboard.
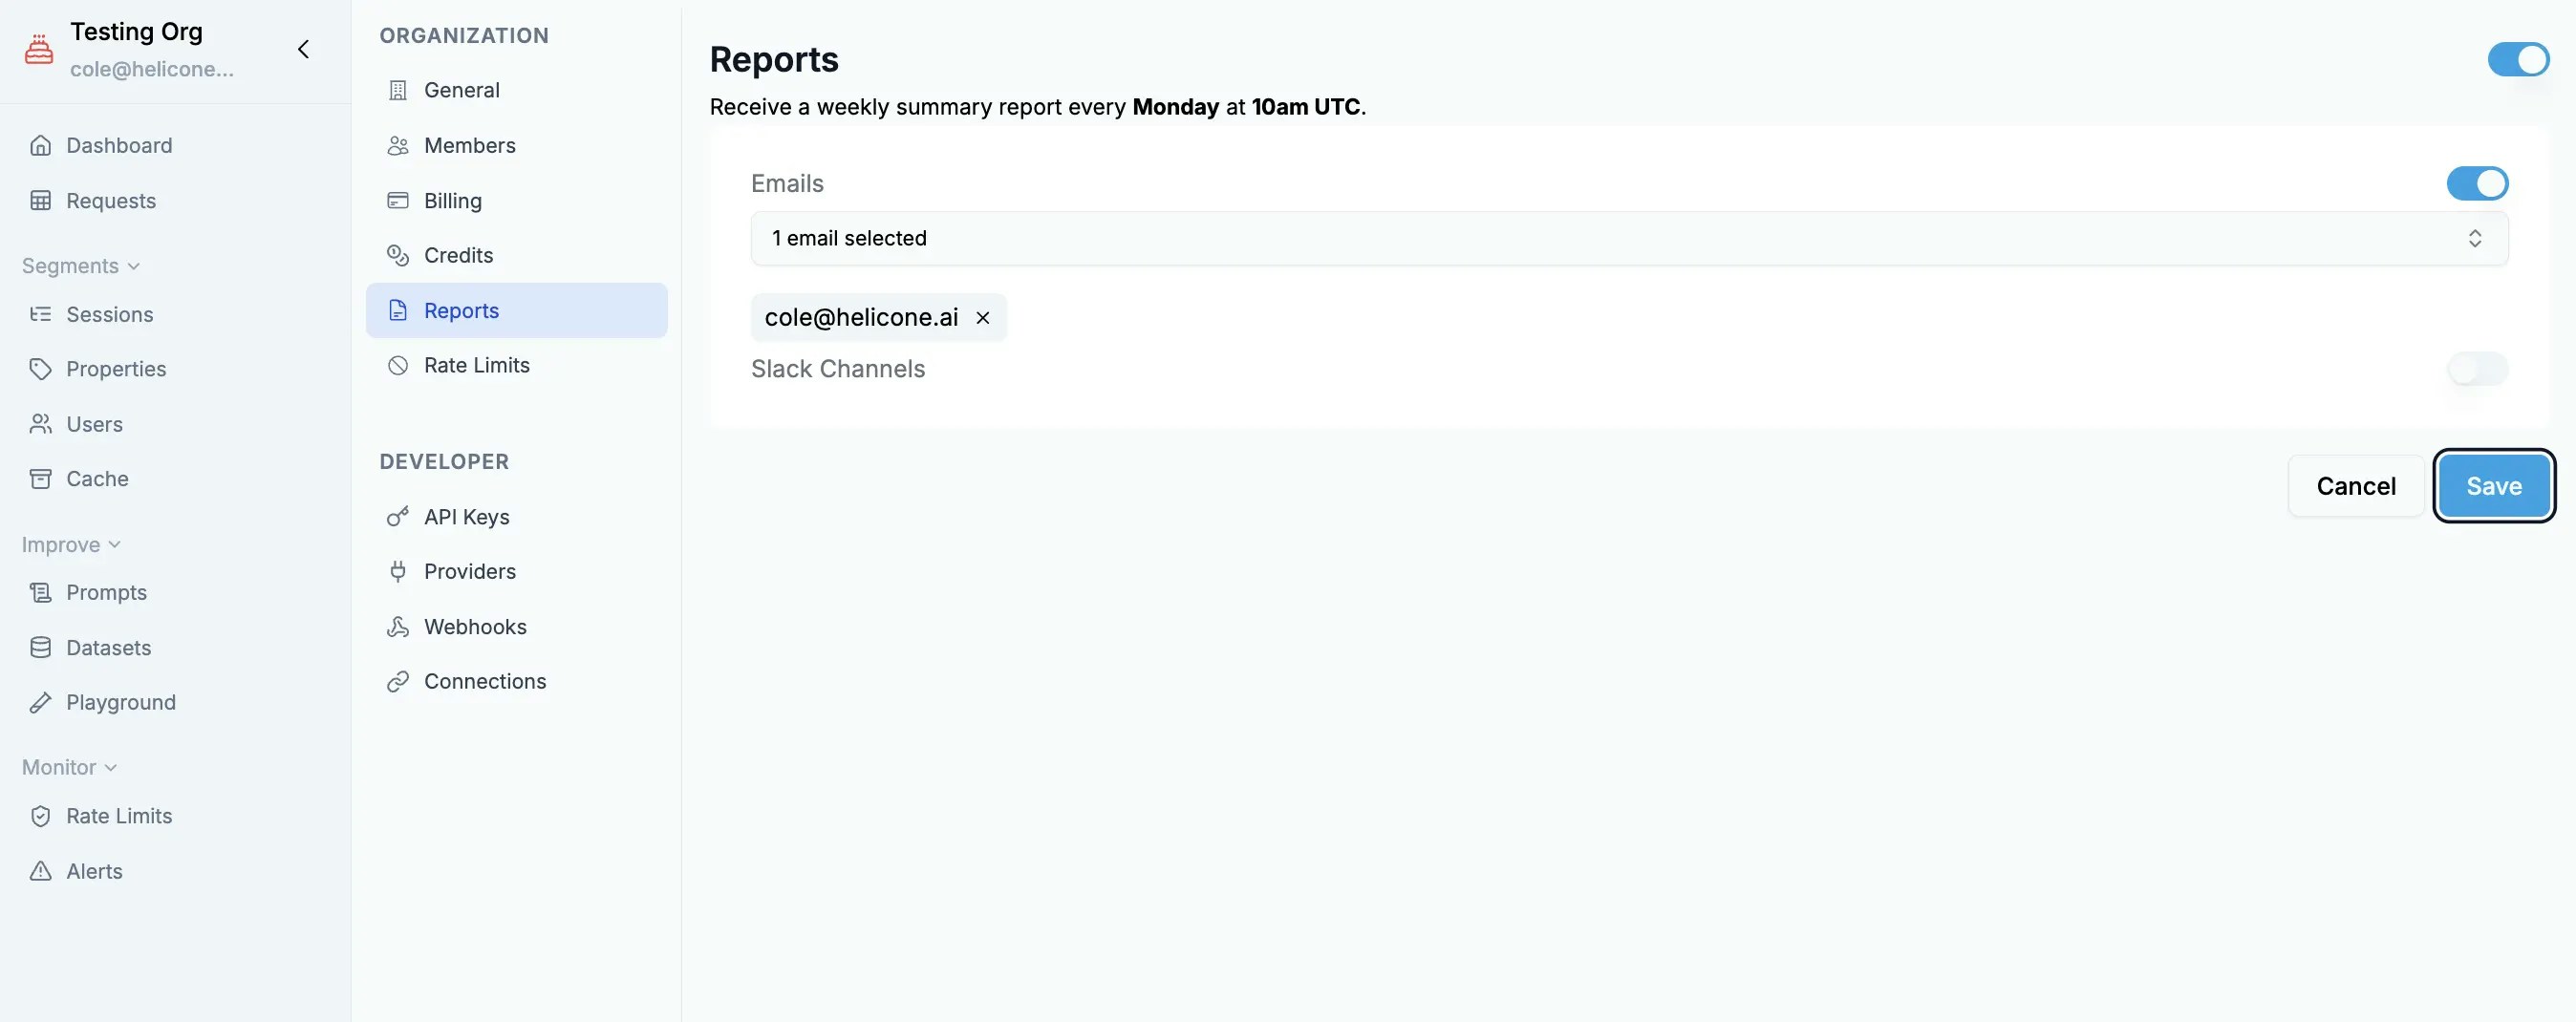 * **Email**: Add recipient email addresses (comma-separated for multiple)
* **Slack**: Select channels from connected Slack workspace
* **Both**: Configure email and Slack for maximum visibility
* **Weekly** (Recommended): Every Monday morning with previous week's data
* **Daily**: For high-volume applications needing close monitoring
* **Monthly**: For quarterly planning and budgeting
Toggle the report status to active and save your configuration
## Report Format
* **Email**: Add recipient email addresses (comma-separated for multiple)
* **Slack**: Select channels from connected Slack workspace
* **Both**: Configure email and Slack for maximum visibility
* **Weekly** (Recommended): Every Monday morning with previous week's data
* **Daily**: For high-volume applications needing close monitoring
* **Monthly**: For quarterly planning and budgeting
Toggle the report status to active and save your configuration
## Report Format
 ### Email Reports
Formatted HTML emails with your weekly metrics, trends, and direct links to the dashboard for deeper analysis.
### Slack Reports
Concise summaries posted to your team channels with key metrics and interactive buttons to view details in the dashboard.
## Understanding Your Report
Reports show week-over-week comparisons of your key metrics, helping you identify trends in usage, spending, and performance. All metrics cover the previous 7-day period.
Reports rely on accurate cost data. If costs show as "not supported" for your model, [contact support](https://discord.com/invite/HwUbV3Q8qz) to add pricing.
## Related Features
Real-time notifications for cost spikes and errors
Deep dive into cost analysis and optimization
### Email Reports
Formatted HTML emails with your weekly metrics, trends, and direct links to the dashboard for deeper analysis.
### Slack Reports
Concise summaries posted to your team channels with key metrics and interactive buttons to view details in the dashboard.
## Understanding Your Report
Reports show week-over-week comparisons of your key metrics, helping you identify trends in usage, spending, and performance. All metrics cover the previous 7-day period.
Reports rely on accurate cost data. If costs show as "not supported" for your model, [contact support](https://discord.com/invite/HwUbV3Q8qz) to add pricing.
## Related Features
Real-time notifications for cost spikes and errors
Deep dive into cost analysis and optimization