> ## Documentation Index
> Fetch the complete documentation index at: https://docs.helicone.ai/llms.txt
> Use this file to discover all available pages before exploring further.
# Alerts
> Get notified when your LLM applications hit error thresholds or cost limits
Helicone Alerts let you monitor error rates and costs on LLM requests to catch issues before they impact users. Each alert can be configured with filters and automatically notify through channels like Slack or email.
## Alert Metrics
Helicone supports monitoring multiple metrics to help you track different aspects of your LLM application:
| Metric | Description | Use Cases |
| ---------------------- | ----------------------------------------------------------------------------- | ---------------------------------------------------------------------------------------------------------------------------------------- |
| **Error Rate** | Track the percentage of failed requests (4XX/5XX errors) over a time window | Detect provider outages, catch breaking changes in prompts, monitor deployment health, identify patterns in user inputs causing failures |
| **Cost** | Monitor spending to prevent budget overruns and detect unusual usage patterns | Prevent unexpected bills, track per-environment spending, detect potential abuse, monitor cost trends for specific features or users |
| **Latency** | Track response time for LLM requests | Monitor performance degradation, ensure SLA compliance, detect slow endpoints |
| **Total Tokens** | Monitor combined prompt and completion token usage | Track overall token consumption, manage rate limits, optimize prompt efficiency |
| **Prompt Tokens** | Track tokens sent in requests | Monitor input size, detect unusually large prompts, optimize context usage |
| **Completion Tokens** | Track tokens generated in responses | Monitor output verbosity, track generation costs, detect runaway generations |
| **Prompt Cache Read** | Track prompt cache read tokens (supported providers) | Monitor cache efficiency, optimize caching strategies |
| **Prompt Cache Write** | Track prompt cache write tokens (supported providers) | Monitor cache population, understand caching patterns |
| **Count** | Track the total number of requests | Monitor usage volume, detect traffic spikes, track feature adoption |
## Creating Alerts
Navigate to **Settings → Alerts** in your Helicone dashboard to create new alerts.
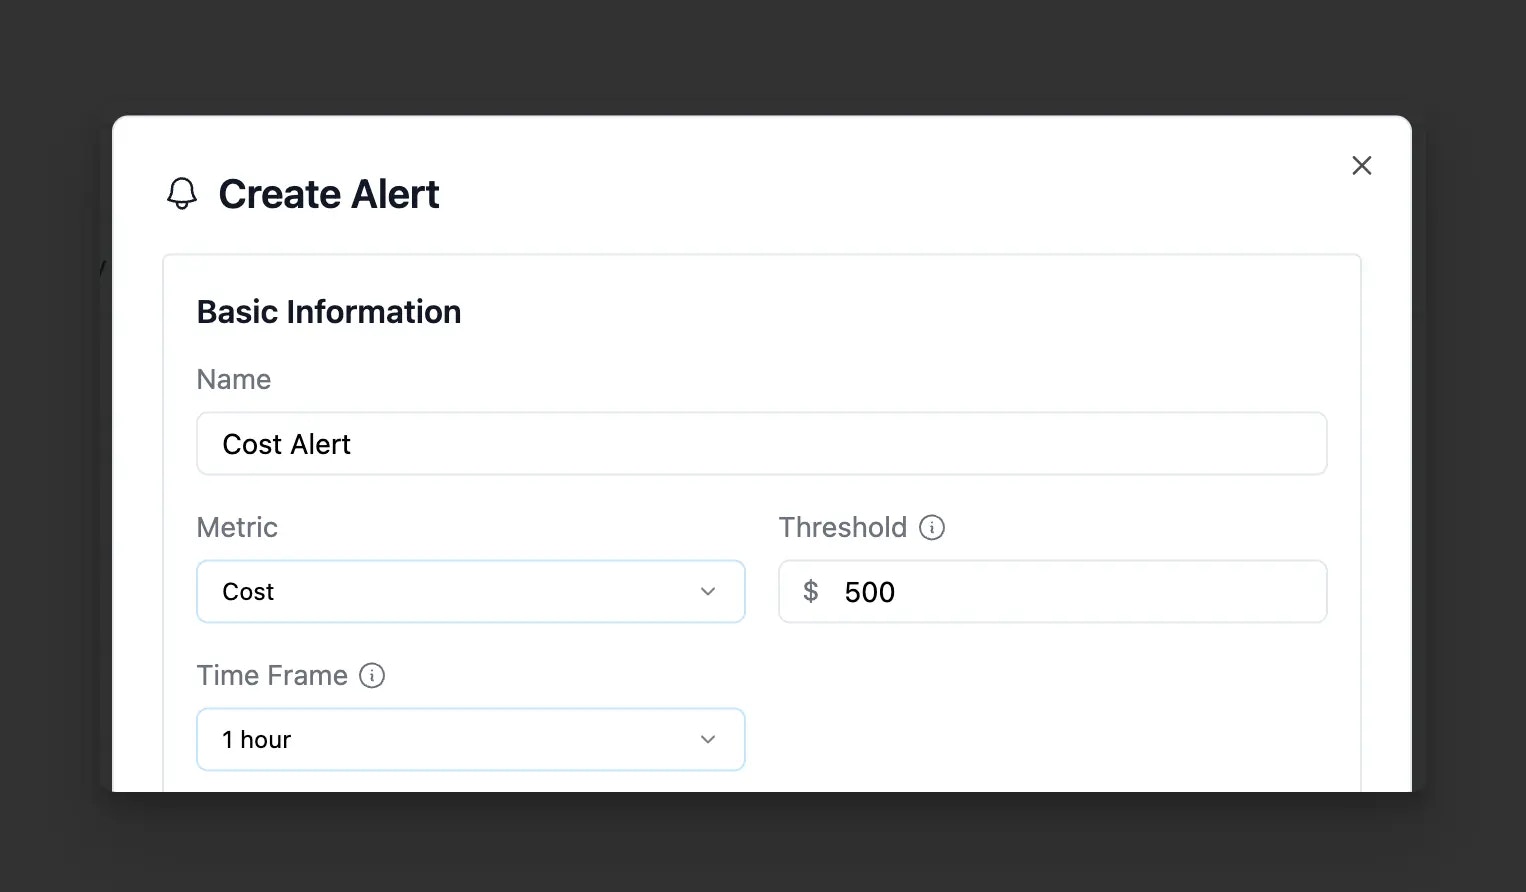
Select the alert type (error rate or cost), set your threshold, and choose a time window.
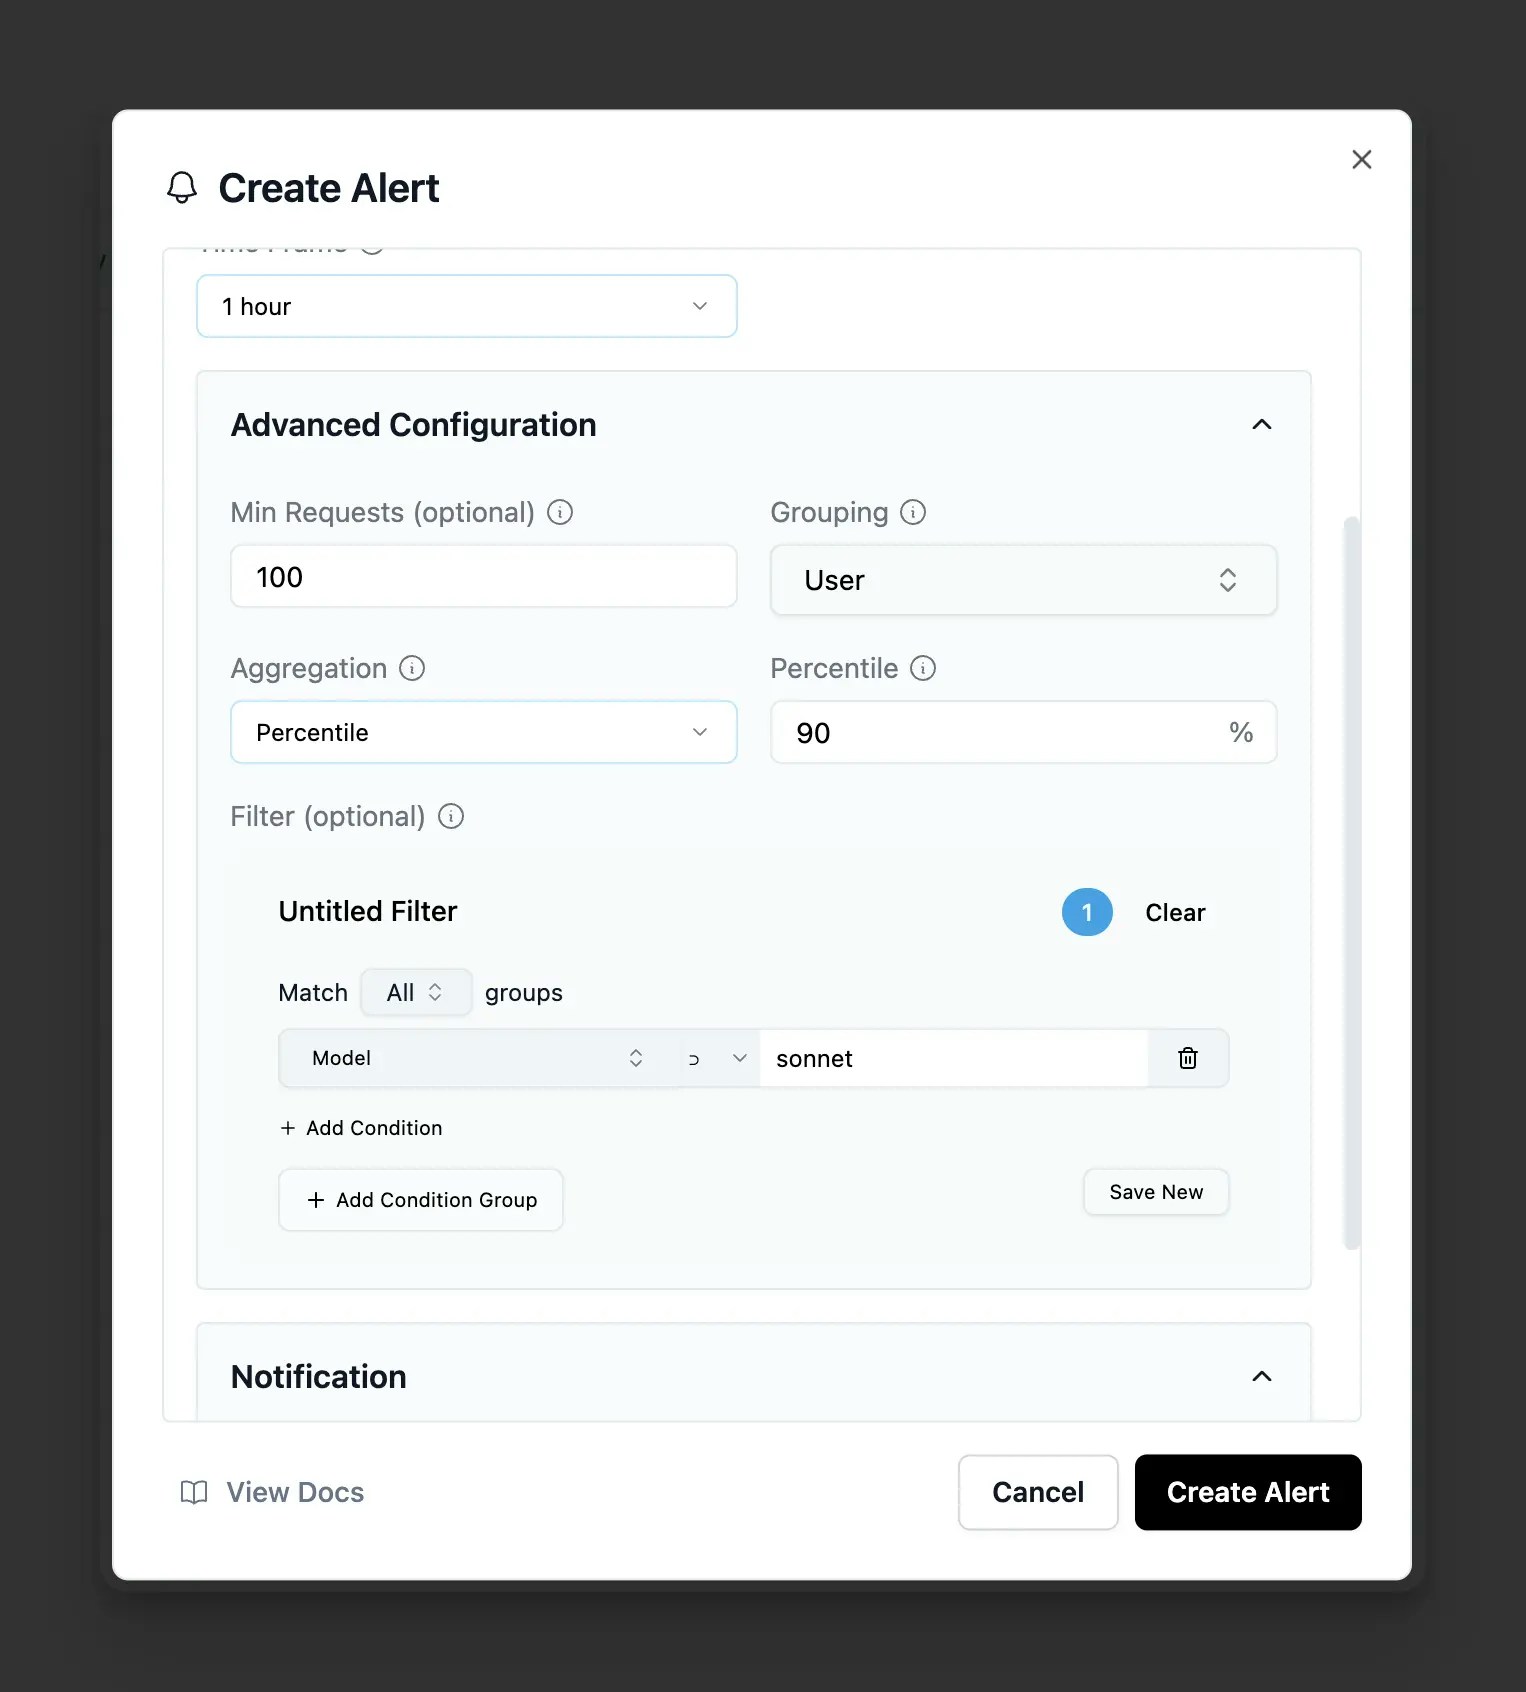
Optionally add filters to target specific traffic, and configure minimum request thresholds to prevent false positives during low traffic periods.
Start with conservative thresholds (higher error %, longer windows) and tighten based on actual patterns. This prevents alert fatigue while you learn your app's normal behavior.
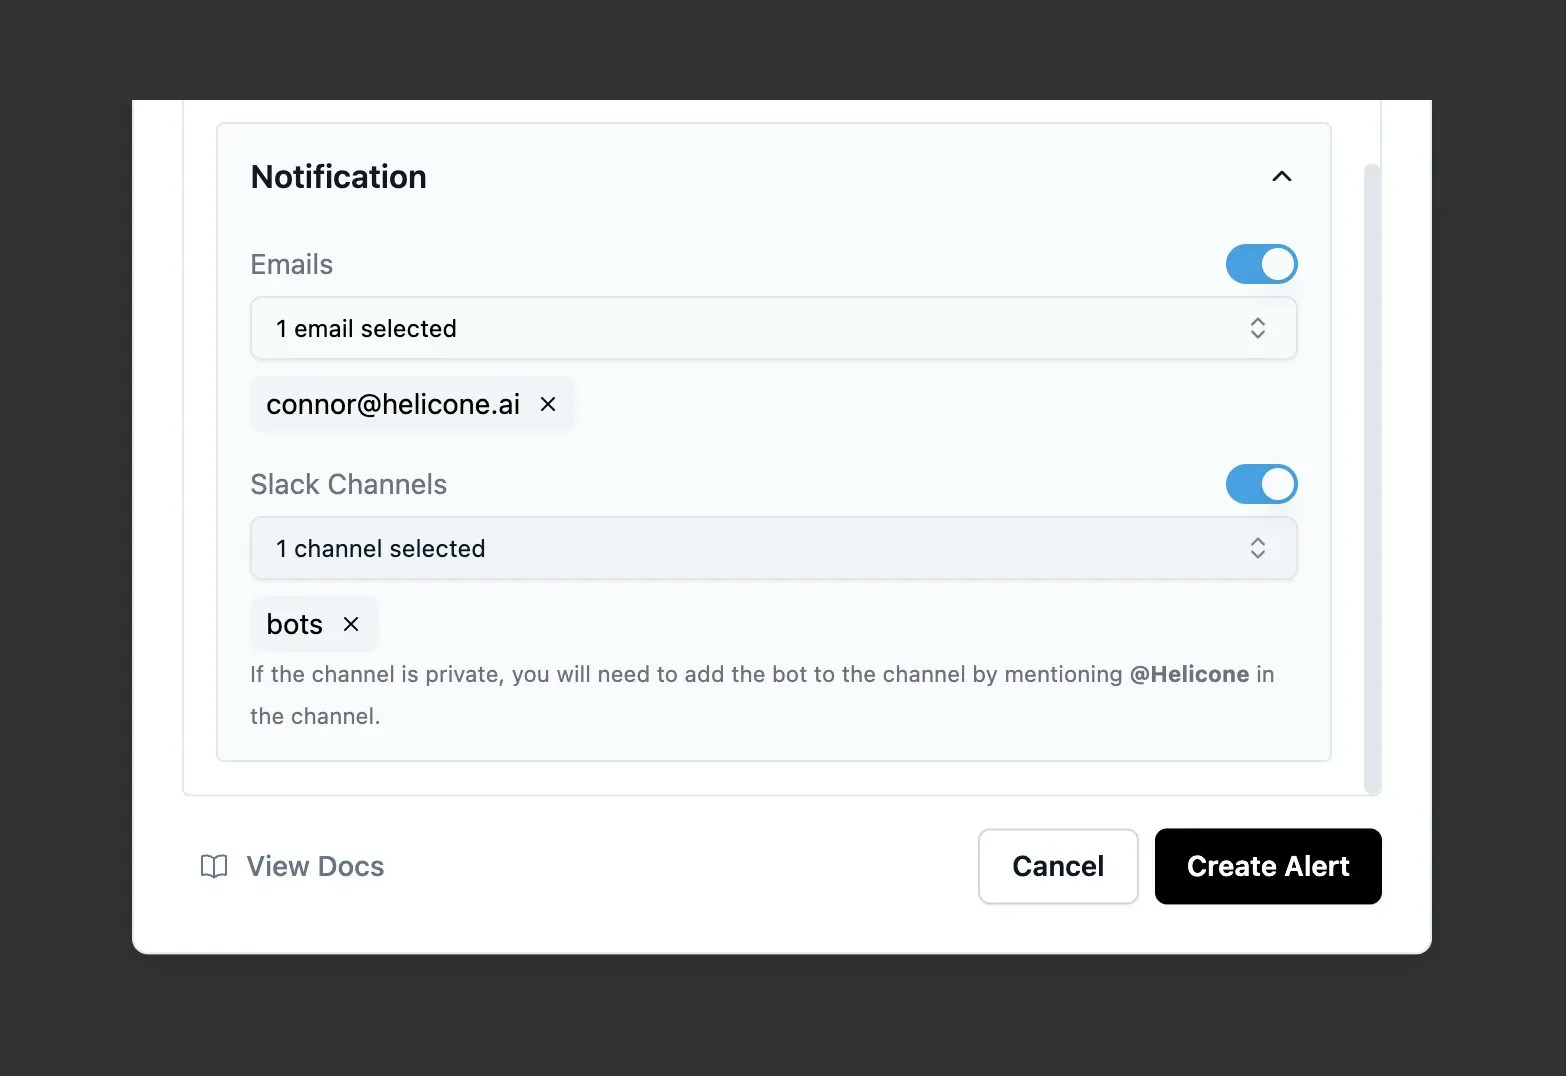
Choose where alerts are sent:
* **Email**: Add any email address (immediate delivery)
* **Slack**: Select connected channels (#alerts, #engineering, etc.)
* **Multiple recipients**: Add several emails or channels per alert
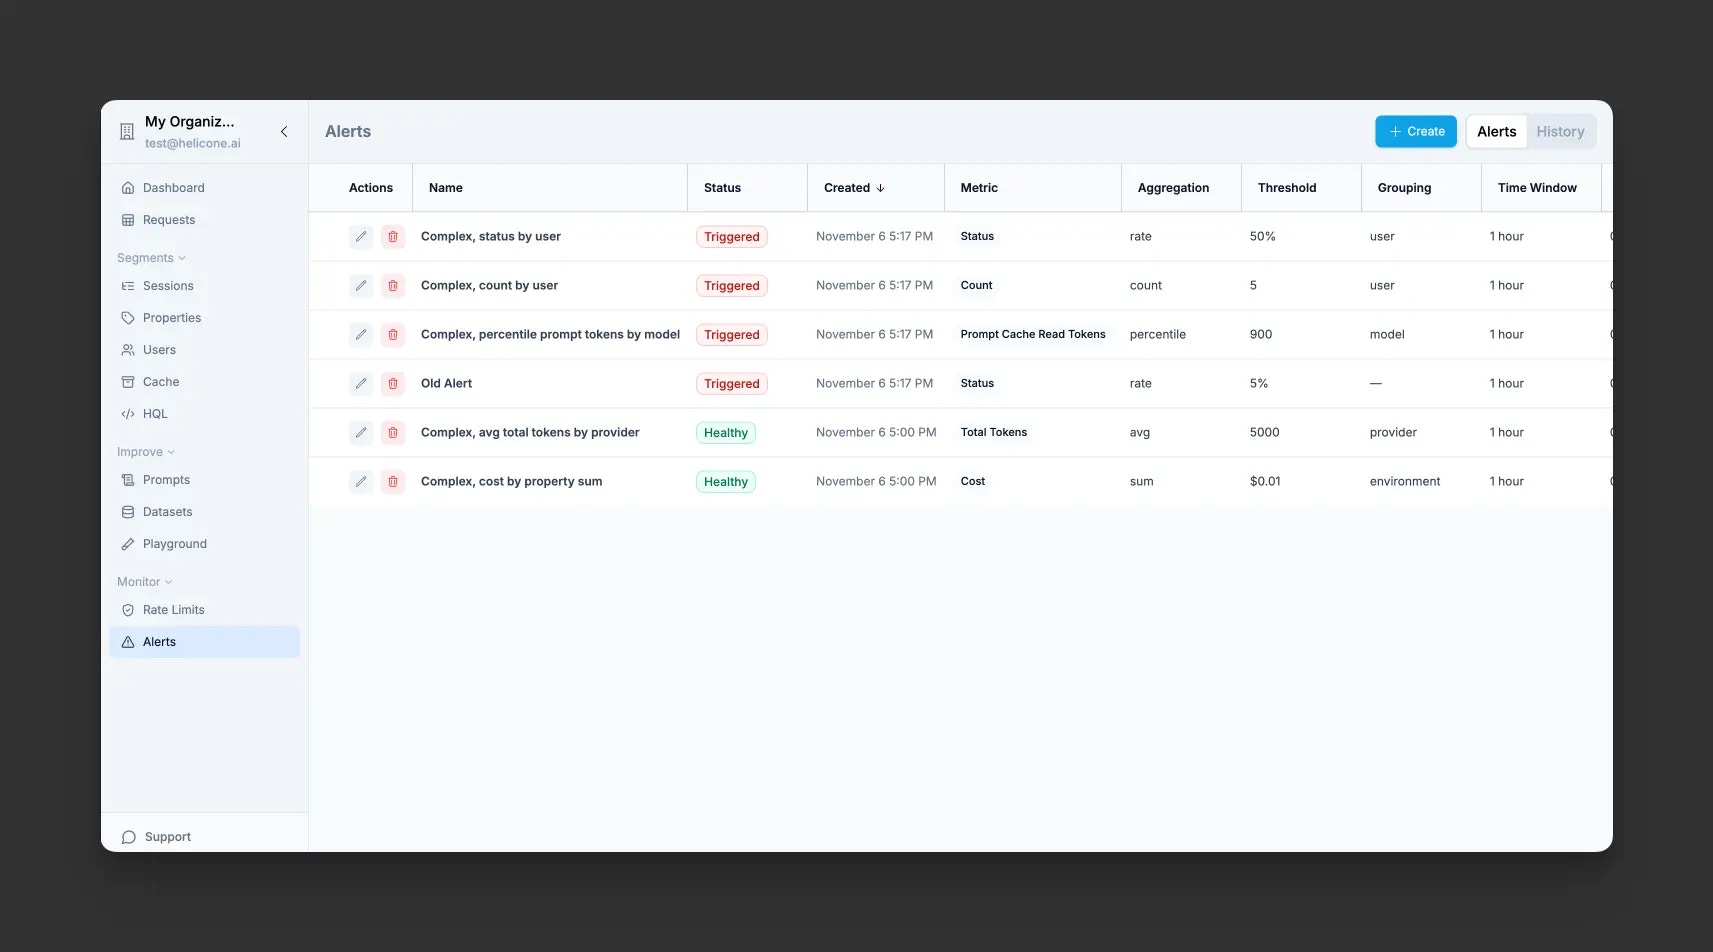
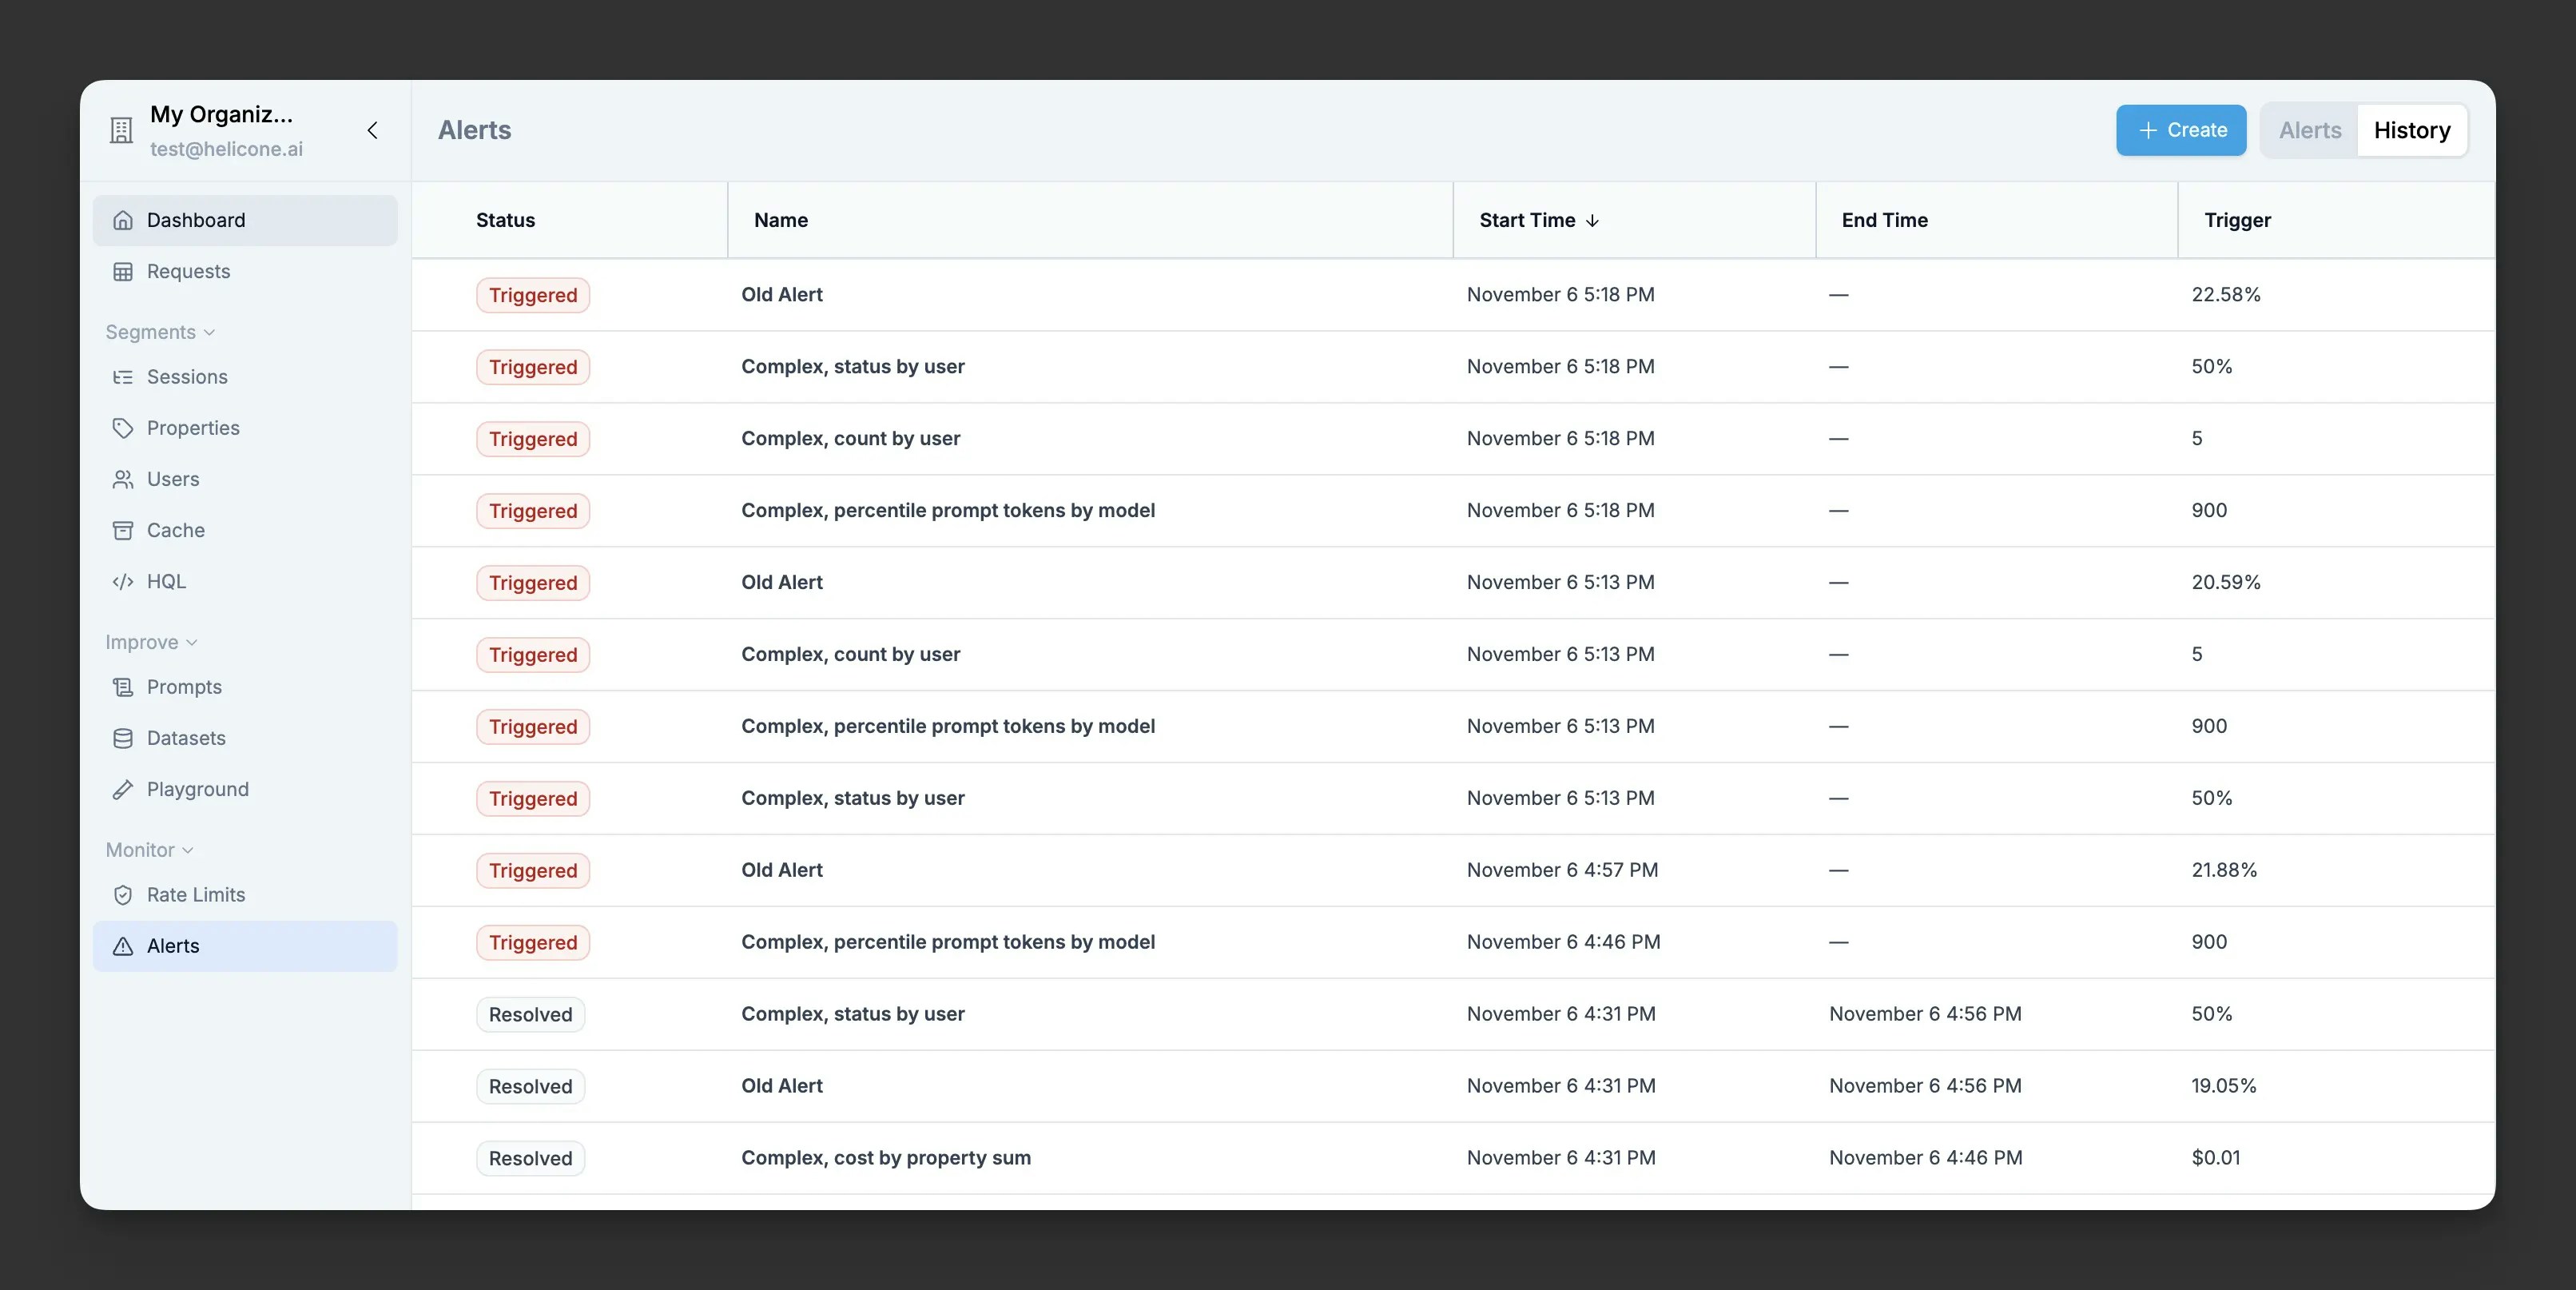 View all configured alerts, their current status, and recent trigger history in the dashboard. When an alert triggers, you can immediately see affected requests and investigate the issue.
## Configuration
### Basic Configuration
Every alert requires these fundamental settings:
* **Metric** - Choose from error rate, cost, latency, token metrics (total, prompt, completion, cache read/write), or request count
* **Threshold** - The value that triggers the alert:
* Error rate: Percentage (e.g., 5-10% for production)
* Cost: Dollar amount (e.g., $100, $1000)
* Latency: Milliseconds (e.g., 1000ms, 5000ms)
* Tokens: Token count (e.g., 100000, 1000000)
* Count: Number of requests (e.g., 1000, 10000)
* **Time Frame** - Evaluation window for aggregating metrics (e.g., last 30 minutes, last 24 hours, last 30 days)
### Advanced Configuration (Optional)
Fine-tune your alerts with these optional settings:
* **Min Requests** - Minimum number of requests required before the alert can trigger. Prevents false positives during low traffic periods (e.g., set to 10 to require at least 10 requests in the time window)
* **Grouping** - Break down alerts by specific dimensions to track violations per group:
* **Standard groupings**: User, Model, Provider
* **Custom properties**: Any custom property you've added to your requests
* When enabled, the alert tracks each group independently and shows which specific groups violated the threshold
* **Aggregation** - Choose how to calculate the metric value:
* **Sum** (default): Total of all values (e.g., total cost, total tokens)
* **Average**: Mean value across requests (e.g., average latency)
* **Min**: Minimum value observed
* **Max**: Maximum value observed
* **Percentile**: Specify a percentile (e.g., p50, p95, p99 for latency)
* **Filter** - Target specific subsets of your traffic using the same powerful filter system as the Requests page
## Notification Channels
### Email Notifications
View all configured alerts, their current status, and recent trigger history in the dashboard. When an alert triggers, you can immediately see affected requests and investigate the issue.
## Configuration
### Basic Configuration
Every alert requires these fundamental settings:
* **Metric** - Choose from error rate, cost, latency, token metrics (total, prompt, completion, cache read/write), or request count
* **Threshold** - The value that triggers the alert:
* Error rate: Percentage (e.g., 5-10% for production)
* Cost: Dollar amount (e.g., $100, $1000)
* Latency: Milliseconds (e.g., 1000ms, 5000ms)
* Tokens: Token count (e.g., 100000, 1000000)
* Count: Number of requests (e.g., 1000, 10000)
* **Time Frame** - Evaluation window for aggregating metrics (e.g., last 30 minutes, last 24 hours, last 30 days)
### Advanced Configuration (Optional)
Fine-tune your alerts with these optional settings:
* **Min Requests** - Minimum number of requests required before the alert can trigger. Prevents false positives during low traffic periods (e.g., set to 10 to require at least 10 requests in the time window)
* **Grouping** - Break down alerts by specific dimensions to track violations per group:
* **Standard groupings**: User, Model, Provider
* **Custom properties**: Any custom property you've added to your requests
* When enabled, the alert tracks each group independently and shows which specific groups violated the threshold
* **Aggregation** - Choose how to calculate the metric value:
* **Sum** (default): Total of all values (e.g., total cost, total tokens)
* **Average**: Mean value across requests (e.g., average latency)
* **Min**: Minimum value observed
* **Max**: Maximum value observed
* **Percentile**: Specify a percentile (e.g., p50, p95, p99 for latency)
* **Filter** - Target specific subsets of your traffic using the same powerful filter system as the Requests page
## Notification Channels
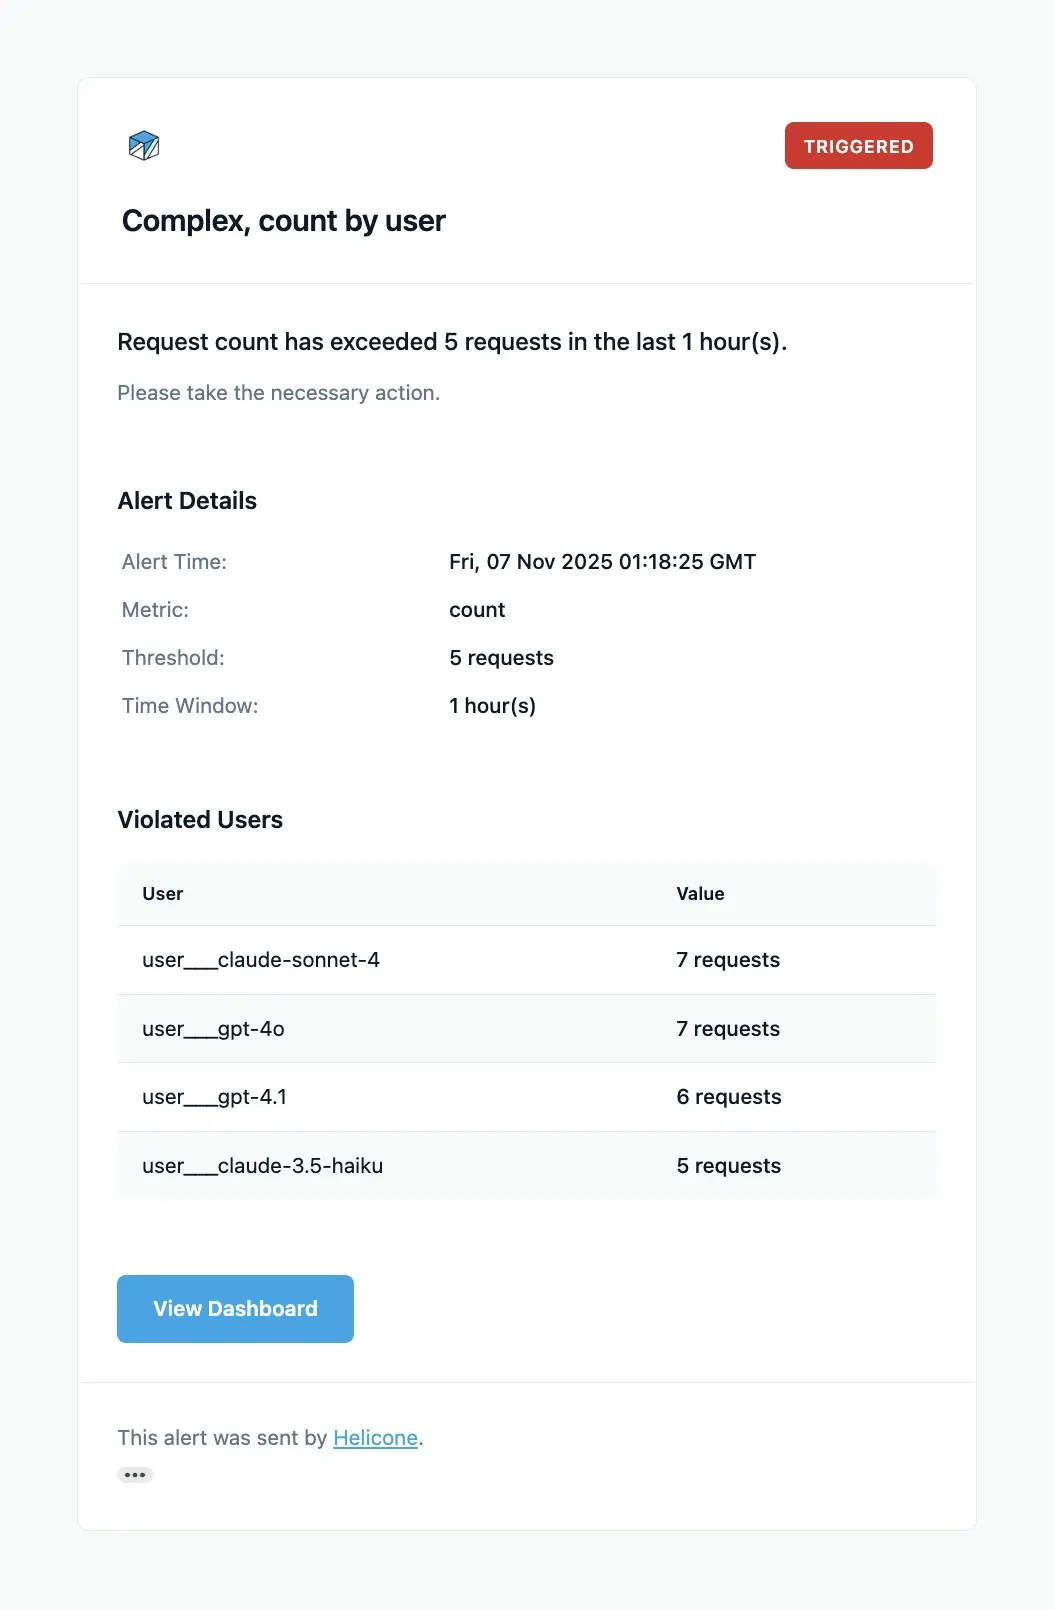
### Email Notifications
### Slack Integration
When creating or editing an alert:
1. Select **Slack** as the notification method
2. Click **Connect Slack** button that appears
3. Authorize Helicone in your Slack workspace
4. Select a channel from the dropdown (#alerts, #engineering, etc.)
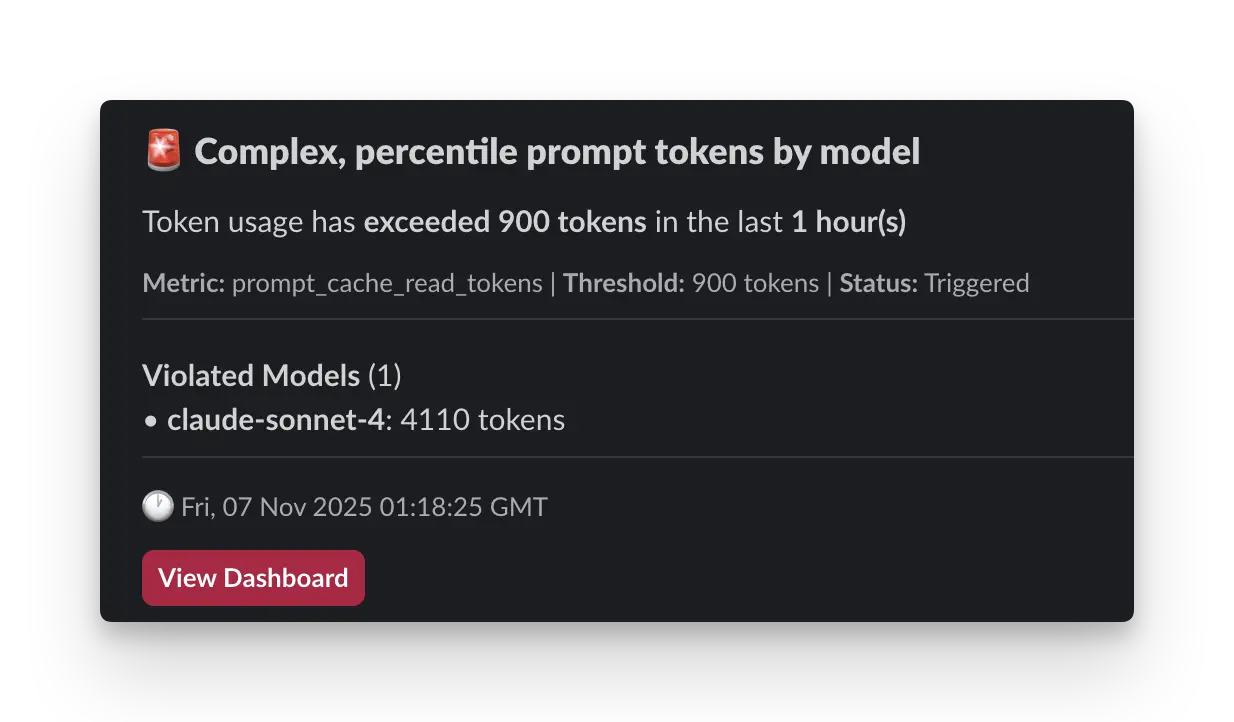
After connecting, you can simply select any channel from your workspace. Slack messages include the same details as emails with rich formatting and direct links to view affected requests.
 ## Related Features
Filter alerts by environment, feature, or user segment
Track costs and errors per user to set appropriate thresholds
Monitor multi-step workflows that might trigger alerts
Collect examples of requests that triggered alerts for analysis
## Related Features
Filter alerts by environment, feature, or user segment
Track costs and errors per user to set appropriate thresholds
Monitor multi-step workflows that might trigger alerts
Collect examples of requests that triggered alerts for analysis